TSLA 매수 분석
- 신뢰도
- 75
- 진입
- 398.73
- 목표
- 480.00
- 손절
- 345.00
- 공개일
- 2026-05-07
요약
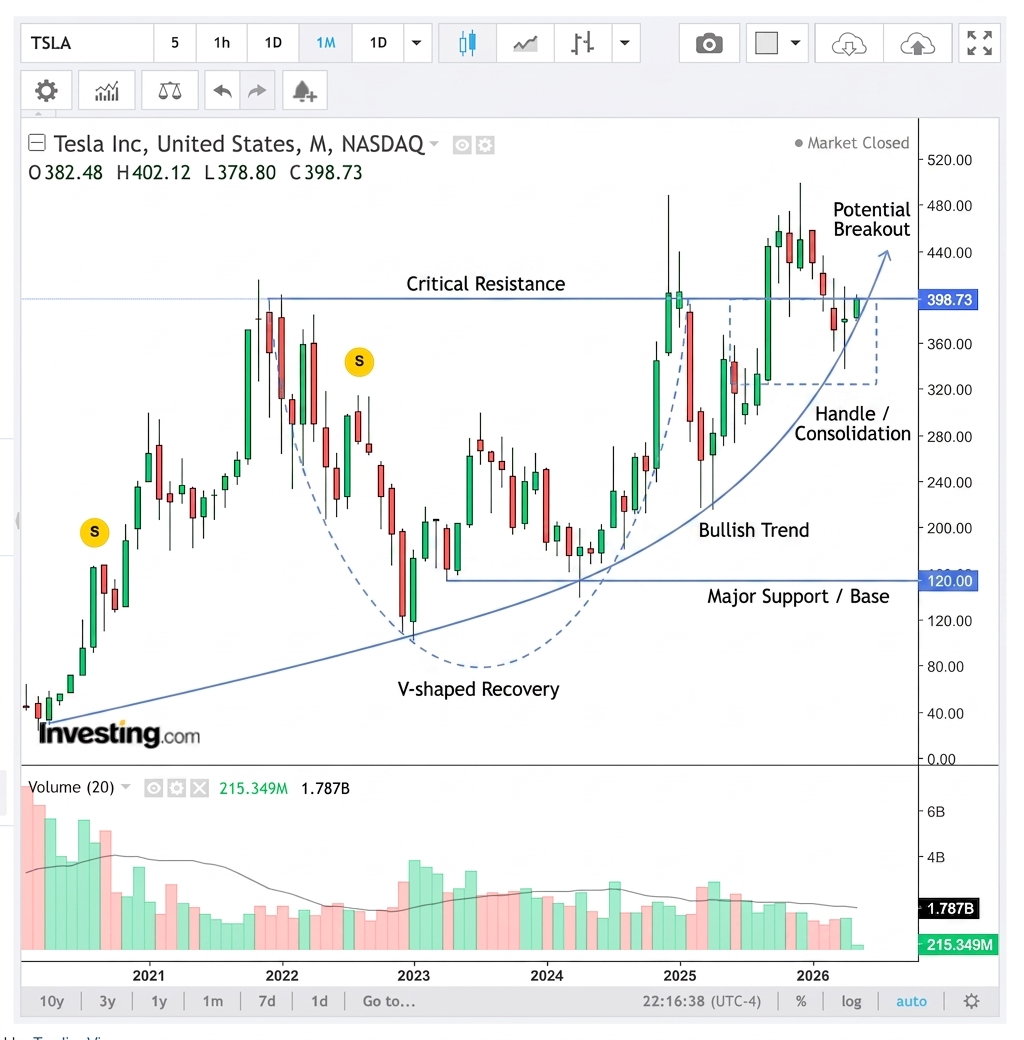
TSLA exhibits strong bullish momentum on the monthly chart, approaching a critical historical resistance level near $400 with high potential for a significant breakout.
추세
The macro trend is strongly bullish. Following a deep and volatile correction, the asset has formed a V-shaped recovery and is establishing higher lows, indicating a resurgence of strong institutional buying interest over the long term.
패턴
The price action suggests a massive, multi-year cup and handle formation or a large base-building phase just below previous all-time highs. The current consolidation tightens near the 'handle' portion, preceding a potential explosive upward move.
지표
A sequence of strong green monthly candles highlights sustained upward momentum. While overall trading volume has diminished from historical peaks, the steady price climb against lower volume suggests an absence of significant selling pressure at current levels. A volume expansion on a breakout above $415 is crucial for confirmation.
전략
Initiate a long position near current levels in anticipation of a breakout above the $400-$415 resistance zone. Place a stop loss below the recent monthly structural support to protect against a potential 'double top' rejection, and target the previous historical wick highs for take profit.
투자 권유가 아닌 참고 정보예요. 매매 판단과 책임은 본인에게 있어요.