NVDA 매수 분석
- 신뢰도
- 80
- 진입
- 215.2
- 목표
- 235.0
- 손절
- 196.0
- 공개일
- 2026-05-11
요약
NVDA is in a robust short-to-medium-term uptrend, having recently broken out of a substantial consolidation base with strong momentum.
추세
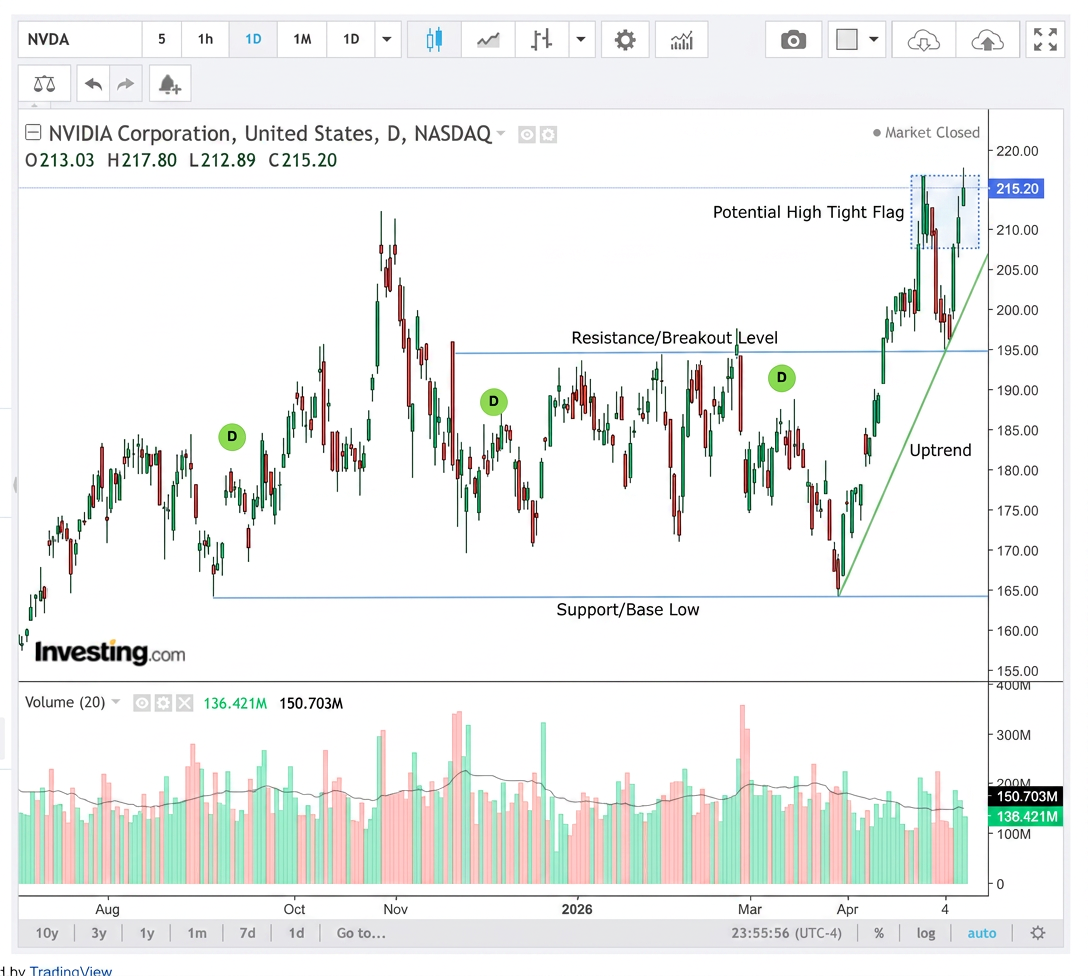
The daily chart indicates a clear and powerful upward trend. After a volatile, choppy period of consolidation between roughly the 165 and 195 price levels, the stock has decisively broken out to the upside, establishing a series of new higher highs and higher lows. The trend is currently dominated by buyers.
패턴
The extended sideways price action formed a significant base. The recent surge above the 195-200 area constitutes a major breakout. The current price action near 215 is consolidating these gains, potentially forming a bullish continuation pattern like a high tight flag before further upward movement.
지표
Price action and candlestick structure are overwhelmingly bullish, characterized by long green candles on up weeks and relatively shallow pullbacks. While specific oscillators aren't visible, the strong structural breakout is a primary bullish signal. Volume appears solid enough to sustain the current move.
전략
Initiate a long position near the current price level, capitalizing on the strong upward momentum. To manage risk, set a stop-loss below the crucial breakout level (former resistance, now support) around the 196-198 area. This protects against a false breakout scenario. Set an initial take-profit target at a higher psychological level, such as 235, allowing the profitable trade to run.
투자 권유가 아닌 참고 정보예요. 매매 판단과 책임은 본인에게 있어요.