ETH 매수 분석
- 신뢰도
- 70
- 진입
- 2,291
- 목표
- 2,850
- 손절
- 1,850
- 공개일
- 2026-05-13
요약
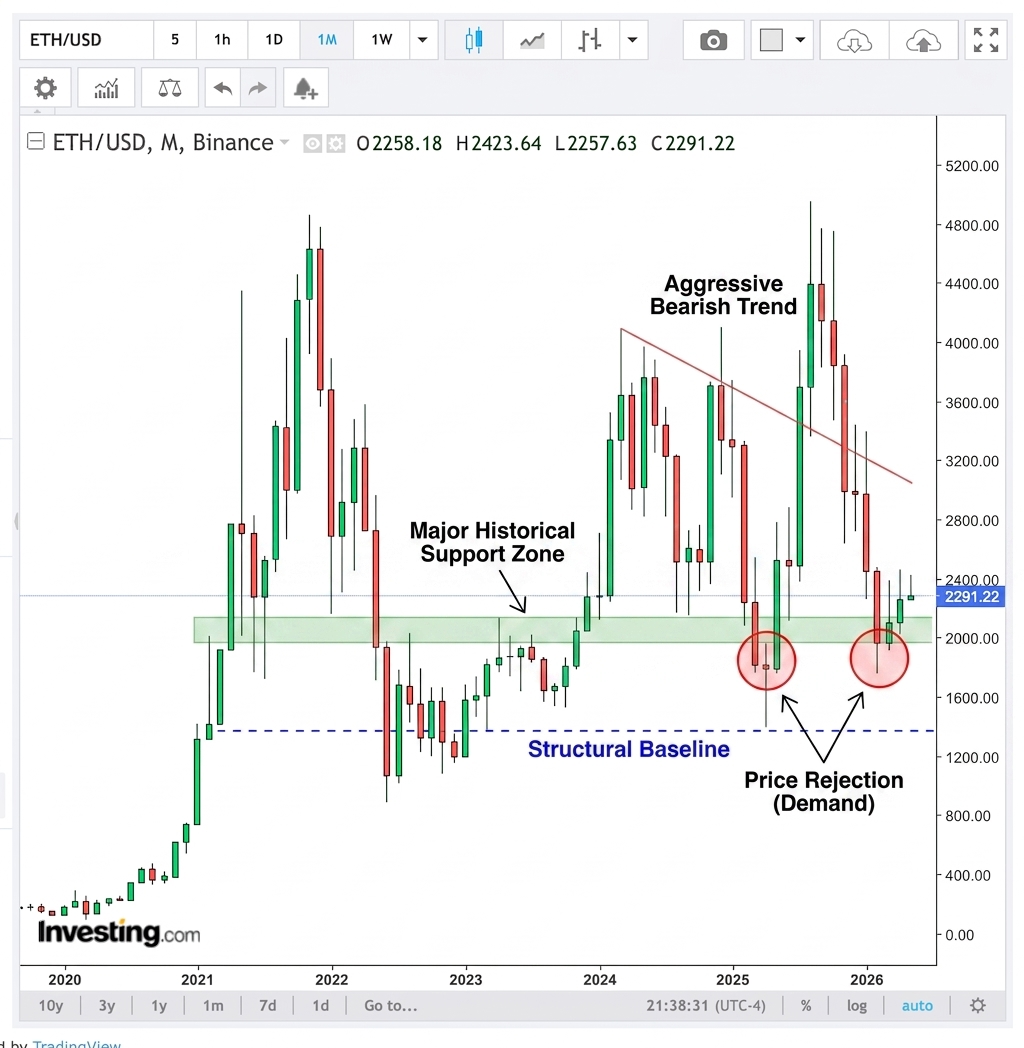
Ethereum has reached a major historical support zone around $2,000 to $2,200, showing strong signs of demand through price rejection logic on recent monthly candles.
추세
While the immediate multi-month trend is aggressively bearish following a sharp decline from near all-time highs, the macro structure remains within a massive multi-year consolidation range. Price is currently testing the lower bounds of an essential structural baseline.
패턴
Recent candlestick formations exhibit long lower tails (wicks) penetrating below $2,000 that were quickly bought up. This pattern at a known support level typically precedes a relief rally or a structural bottom.
지표
Based strictly on price action, the velocity of the sell-off has visibly decelerated. The absorption of selling pressure at the $2,000 psychological level implies a potential inflection point where buyers are stepping in to accumulate.
전략
Initiate a long swing position near current market prices to capitalize on a potential oversold bounce. Given the severity of the prior downtrend, a strict stop-loss must be placed underneath the recent lowest wick to protect against further downside continuation. Target the initial breakdown level as a primary exit.
투자 권유가 아닌 참고 정보예요. 매매 판단과 책임은 본인에게 있어요.