BUMI 매수 분석
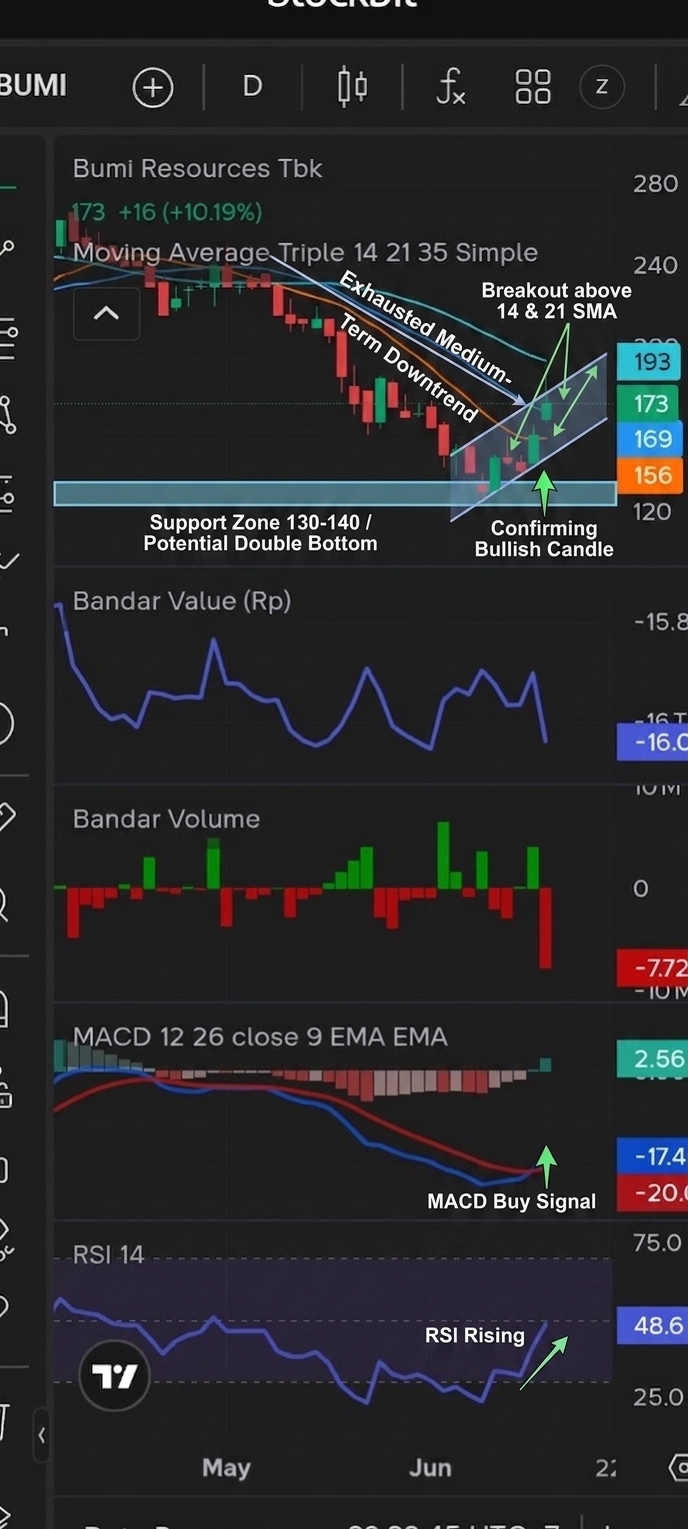
- 신뢰도
- 75
- 진입
- 173
- 목표
- 195
- 손절
- 150
- 공개일
- 2026-06-15
요약
BUMI is showing strong signs of a bullish trend reversal after finding a bottom, supported by momentum oscillators and moving average breakouts.
추세
The medium-term downtrend is showing signs of exhaustion. The price has recently rebounded sharply and has successfully closed above both the 14-day (156) and 21-day (169) Simple Moving Averages, indicating a clear shift in short-term momentum to the upside.
패턴
The price action has formed a solid bottom around the 130-140 level, representing a potential double bottom or rounding bottom reversal pattern, confirmed by the recent large bullish candle.
지표
The MACD has executed a bullish crossover well below the zero line, accompanied by ascending green bars on the histogram. Additionally, the RSI (14) has rebounded strongly from oversold territory and is currently rising at 48.6, suggesting substantial room for further upward movement.
전략
Enter long at the current price of 173. Set a stop loss below the key moving average support at 150 to manage risk, and target a move towards the 35-day SMA resistance near 195.
투자 권유가 아닌 참고 정보예요. 매매 판단과 책임은 본인에게 있어요.