BTCUSD 매도 분석
- 신뢰도
- 75
- 진입
- 60,500
- 목표
- 58,500
- 손절
- 61,500
- 공개일
- 2026-06-26
요약
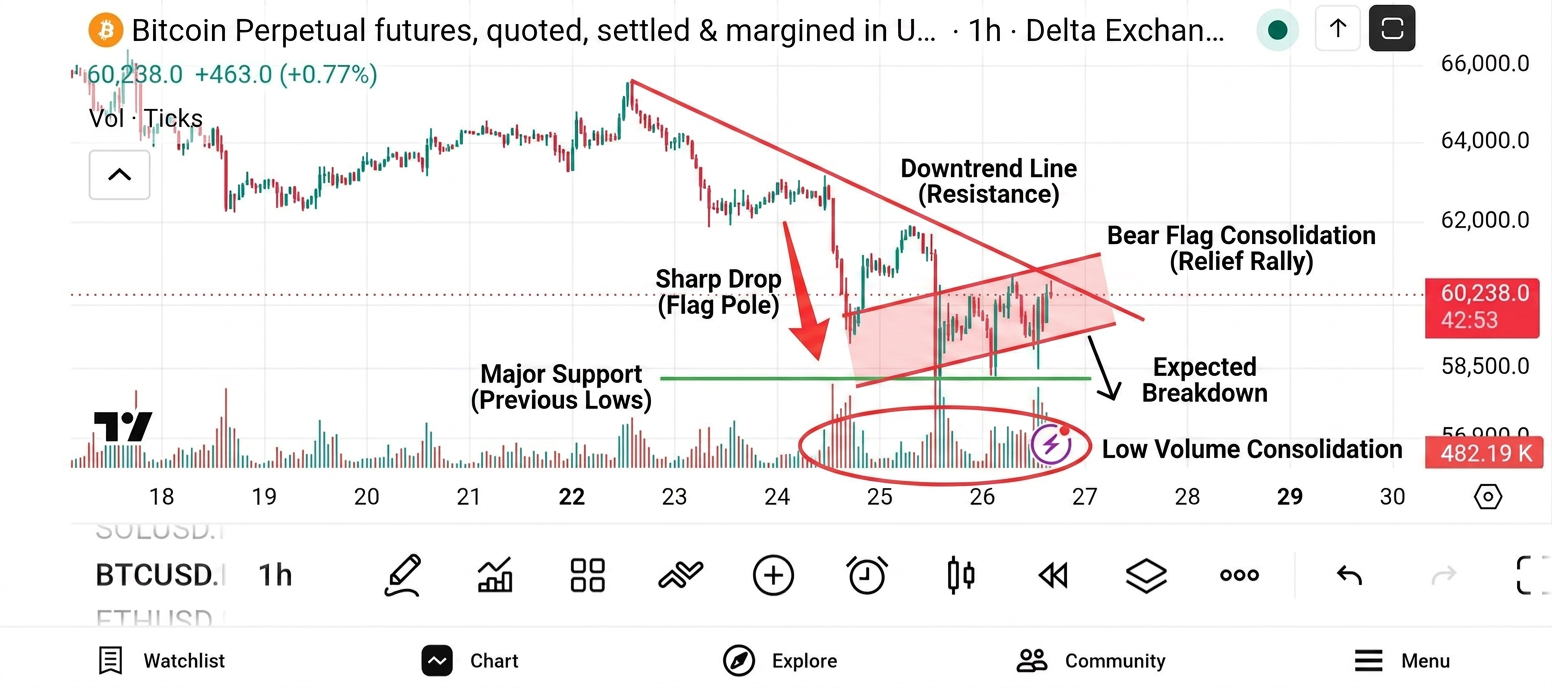
Bitcoin remains in a clear short-term downtrend on the hourly chart, with the current bounce likely representing a corrective relief rally before further downside.
추세
The 1-hour chart displays a market structure characterized by lower highs and lower lows, descending from above 65,000 to lows near 58,000. The dominant trend is bearish.
패턴
The price action suggests a bearish continuation, where the sharp drop on the 24th-25th is followed by a weak, low-volume consolidation/bear flag structure.
지표
Slight volume contraction on the recent rebound indicates a lack of solid buying conviction, keeping the bias firmly to the downside.
전략
Enter short positions on strength near the 60,500 resistance level. Place a stop loss above the recent consolidation high and aim for a retest of the recent support lows.
투자 권유가 아닌 참고 정보예요. 매매 판단과 책임은 본인에게 있어요.