USOUSD 매수 분석
- 신뢰도
- 75
- 진입
- 78.97
- 목표
- 80.45
- 손절
- 78.20
- 공개일
- 2026-07-14
요약
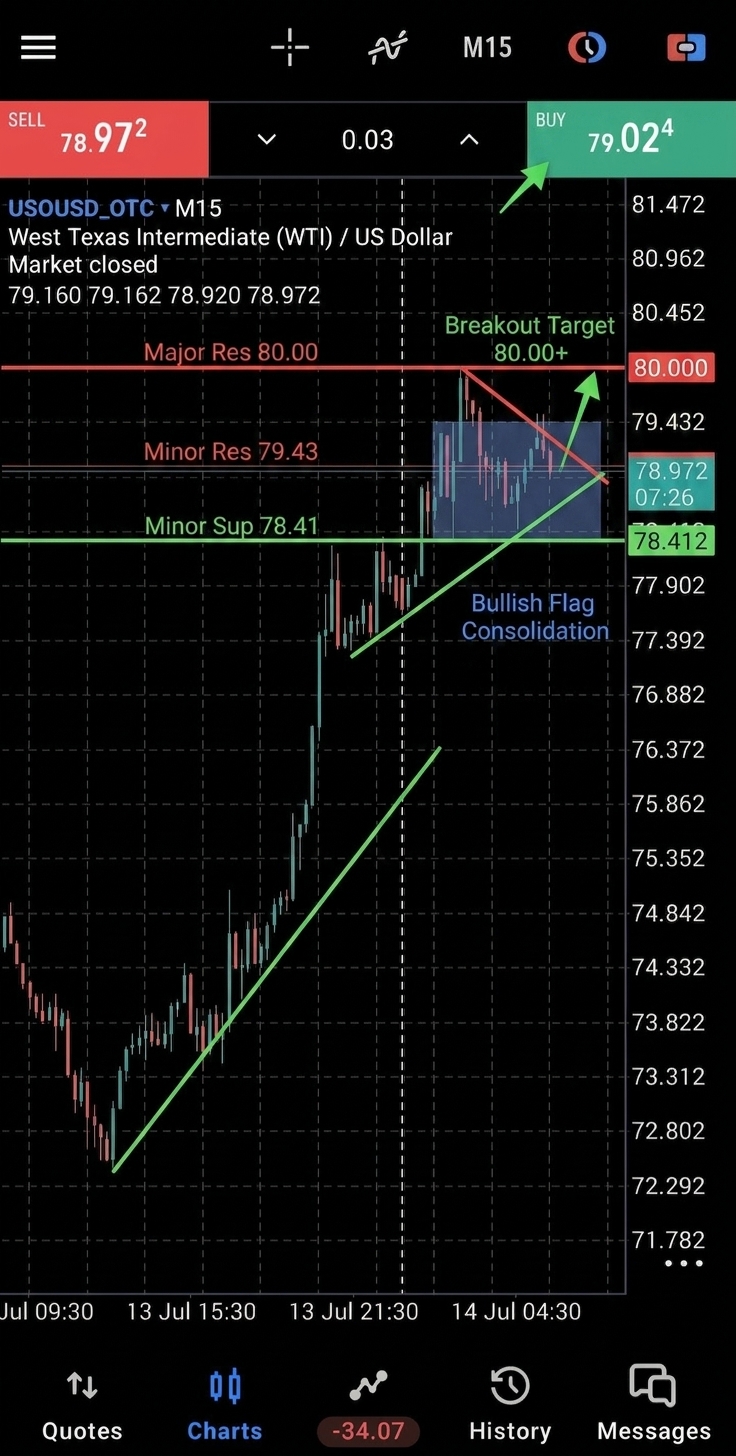
The short-term trend of WTI Crude Oil (USOUSD) is strongly bullish, featuring a massive rally followed by a healthy bullish flag/consolidation pattern above minor support at 78.40. The current price is coiled and ready to embark on a continuation leg higher to retest the psychological and technical barrier around 80.00.
추세
The medium-to-short term trend on this 15-minute chart is robustly bullish, starting from a swing low near 72.50 to a localized high close to 80.00, representing an approximate 10.3% rally. After peaking near 79.94, the price entered a brief, orderly consolidation above 78.41, showing that buyers are heavily defending lower pullbacks. Key moving averages are not plotted on this chart, but the price action exhibits clear higher highs and higher lows, illustrating a powerful uptrend. The upward momentum remains intact as long as the critical swing low structure at 78.41 holds.
패턴
A clear bullish flag or pennant consolidation pattern has formed after the massive vertical run from 73.80 to 79.94. The consolidation occurred between the support level of 78.412 and resistance around 79.432. The recent candles show buyers stepping in around 78.40 to 78.60, establishing a localized double bottom structure during this accumulation phase. A breakout above 79.43 would confirm the continuation of the flag pattern, targeting the major psychological resistance of 80.00 and potentially expanding toward 81.00.
지표
Traditional oscillators such as the Relative Strength Index (RSI) or Moving Average Convergence Divergence (MACD) are not visible on the chart. However, volume-correlated price action shows that the upward impulse legs were swift and dominant, while the downward consolidation phases are marked by overlapping and choppy candles. This footprint represents diminishing selling pressure, which normally points to an imminent upward continuation. The current price has successfully closed back above the immediate horizontal pivot level of 78.972.
전략
The proposed strategy is to go long upon a minor continuation pattern breakout or around the current price cluster. Entry is planned at 78.97, which serves as a vital structural pivot. We will place a protective stop loss just below the recent swing low and the flag boundary at 78.20. The primary take profit target is set at 80.45, capturing the next major resistance levels just past the significant 80.00 psychological threshold.
투자 권유가 아닌 참고 정보예요. 매매 판단과 책임은 본인에게 있어요.