차트 매수 분석
- 신뢰도
- 75
- 진입
- 4,028
- 목표
- 4,150
- 손절
- 3,970
- 공개일
- 2026-07-16
요약
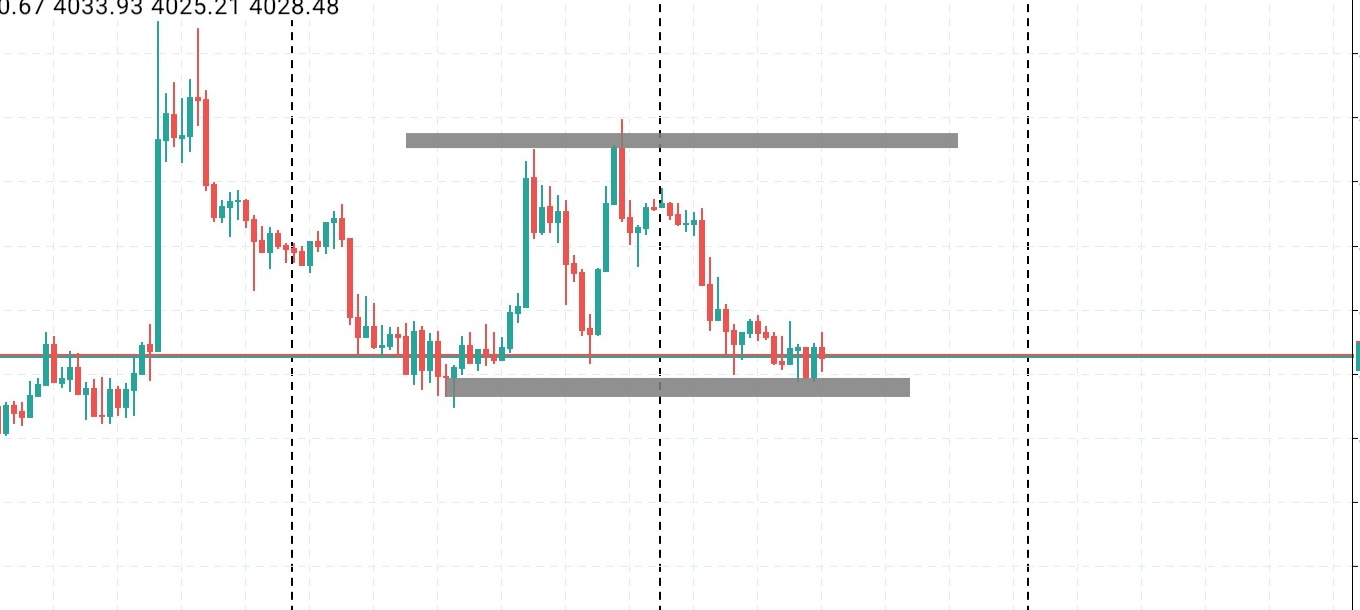
The asset is currently testing a well-defined horizontal support level and demand zone. A long position is favored on the basis of a range-bound bounce back toward the upper resistance band.
추세
The medium-term trend is neutral to sideways, characterized by a clear range-bound structure. Following a dramatic spike on the left side of the chart, the price corrected and has since established a horizontal consolidation pattern. At present, the price is resting directly on a critical horizontal support level near 4028. Moving averages are not explicitly plotted, but the price action itself shows a clear transition from a historical downtrend into a sideways accumulation phase.
패턴
A distinct double-bottom or range-bound consolidation pattern is visible. The lower support range (demarcated by the lower grey block and the red horizontal line) has successfully repelled sellers multiple times. Conversely, the upper resistance zone (demarcated by the upper grey block) has acted as a ceiling during previous rallies. This current retest of the lower boundary offers a highly favorable risk-to-reward setup for a long position.
지표
Traditional oscillators such as RSI and MACD are not displayed on this chart. Volume bars are also absent. The primary technical indicator available is price action itself, which reveals horizontal key levels and candle reaction; the recent small-bodied candles at the red horizontal line indicate that selling momentum is stalling, signaling potential buy-side exhaustion and a likely reversal.
전략
The strategy is to buy the bounce from the current support line at 4028. A tight stop-loss should be positioned just below the lower grey congestion zone to limit risk. The primary take-profit objective is set near the upper boundary of the range, aligned with the previous local swing highs.
투자 권유가 아닌 참고 정보예요. 매매 판단과 책임은 본인에게 있어요.