XAUUSDp 매도 분석
- 신뢰도
- 75
- 진입
- 4,025
- 목표
- 4,013
- 손절
- 4,036
- 공개일
- 2026-07-21
요약
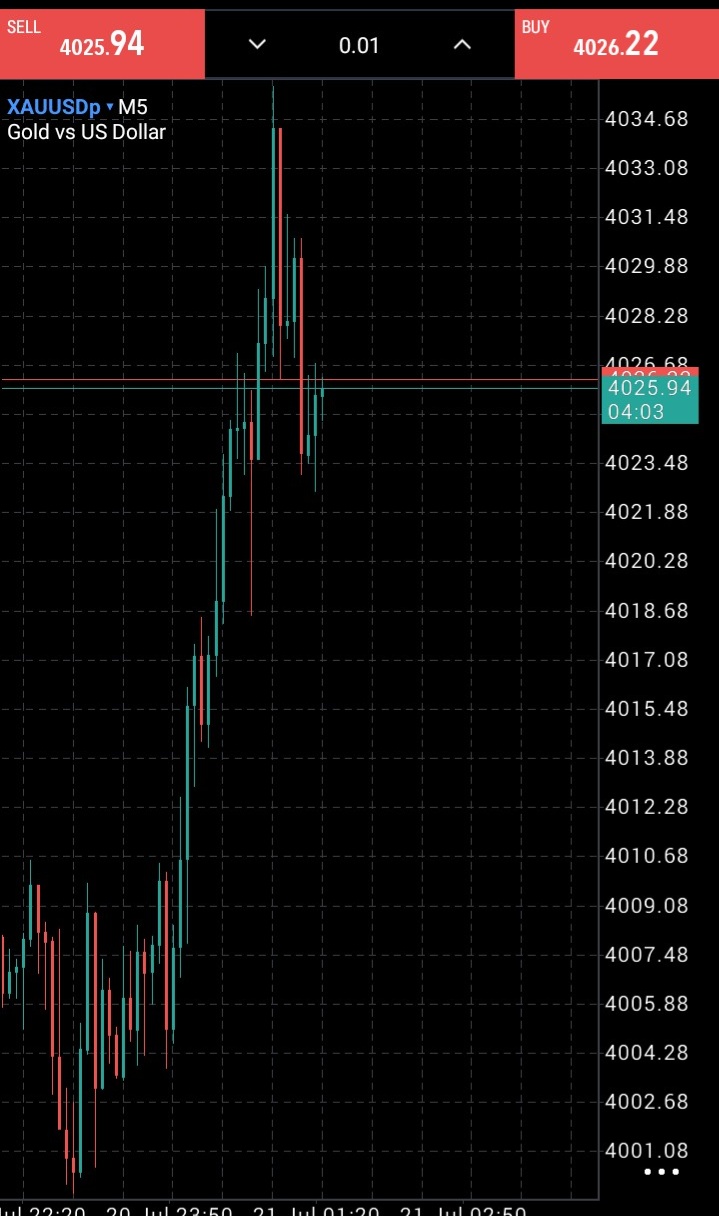
The XAUUSDp 5-minute chart exhibits a classic exhaustion signal, featuring a sharp rejection wick at the session high of 4035 that indicates a bearish reversal or deep correction is underway.
추세
The short-term trend on this M5 chart was highly bullish, embarking on a rapid vertical surge from the low of 4001 up to a peak of 4035. However, this vertical momentum has broken down abruptly, as evidenced by a swift plunge back to the 4022 area. While key moving averages are not plotted on this chart, the sheer velocity of the pullback indicates that the immediate uptrend has lost control to sellers. A breakdown below the 4022 support level would officially confirm a transition into a short-term bearish trend targeting the lower consolidation zones.
패턴
A highly prominent bearish shooting star candlestick pattern is visible at the swing high of 4035, characterized by an exceptionally long upper shadow that demonstrates aggressive rejection of higher prices. This bearish pattern was immediately validated by the subsequent large red candles pushing the price lower. Currently, a small bearish consolidation or bear flag is forming near the 4025.94 mark. A break below the base of this flag flags a continuation pattern targeting a return to lower structural nodes.
지표
No standard indicators like the Relative Strength Index (RSI), MACD, or Bollinger Bands are visible on this chart. The analysis is grounded entirely in price action and horizontal level dynamics. The lack of indicators means we rely on the clean structure of the candles, where the extreme length of the rejection wicks serves as a proxy for overhead supply.
전략
We will initiate a short position at the current market level of 4025. The plan is to capitalize on the bearish momentum triggered by the rejection at 4035. A stop-loss must be placed just above the wick of the rejection candle at 4036 to protect against any unexpected bullish breakout. The primary take-profit target is established at 4013, which lines up with a key congestion zone formed during the initial bullish leg upward.
투자 권유가 아닌 참고 정보예요. 매매 판단과 책임은 본인에게 있어요.