GOLD 매수 분석
- 신뢰도
- 75
- 진입
- 4,017
- 목표
- 4,035
- 손절
- 4,008
- 공개일
- 2026-07-29
요약
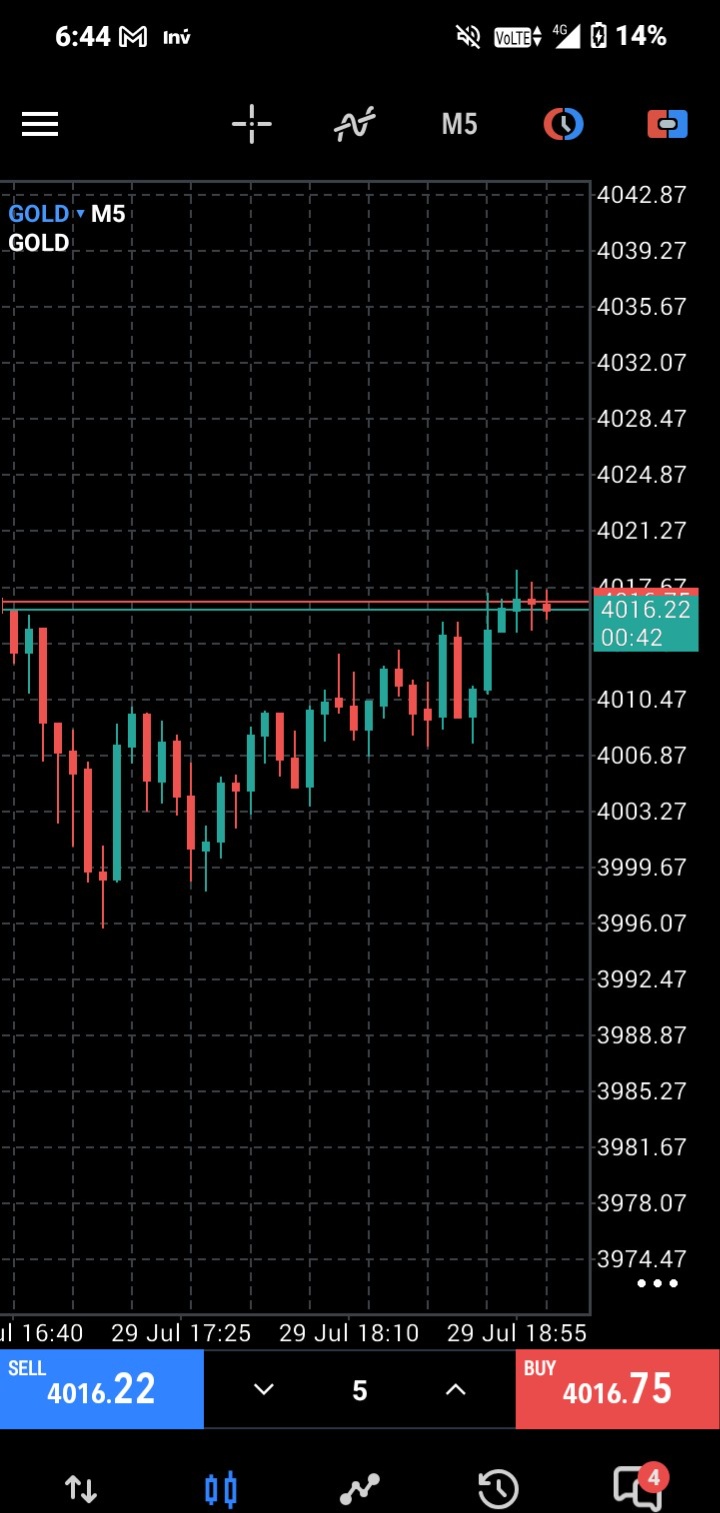
The GOLD M5 chart exhibits a strong recovery trend from its daily low of approximately 3995, and is currently testing a crucial horizontal resistance line around 4016. This structural recovery suggests a high-probability bullish continuation once the near-term resistance is cleared.
추세
Over the displayed period on the 5-minute chart, a clear short-term uptrend has emerged after a sharp decline to a low near 3995 around 17:00. From that bottom, price has established a consistent series of higher lows and higher highs over a 2-hour duration, climbing approximately 0.5% back to 4016. Moving averages are not displayed on the chart, meaning we cannot assess their slope or price interaction. The upward trend remains highly intact as long as price holds above the key intermediate support level of 4008.
패턴
The price structure depicts a rounded bottom or cup-style recovery returning to the previous pivot high established around 16:40 near the 4016 area. Right at this resistance level, the price is consolidating in a tight cluster of 5-minute candles, forming a flag or handle structure. Confirmed breakout of this chart pattern is pending a strong close above 4017.67, which would officially invalidate the local supply. The measured target of this pattern would project an equal move upwards, targeting the 4035 resistance level.
지표
Technical indicators such as the Relative Strength Index (RSI), MACD, and on-balance volume are completely absent from the provided chart view. Consequently, we cannot provide quantitative indicator values or search for momentum divergences. Our indicator-free context forces a reliance on pure price action, where the recent expansion of green candle bodies relative to red ones indicates dominant buying momentum. This lack of indicators slightly reduces overall entry confidence but is mitigated by the clean structural breakout canvas.
전략
The ideal trade execution strategy involves initiating a long position once the price marks a clean 5-minute candle breakout above the 4017 horizontal line. Risk must be strictly managed by placing the stop-loss order at 4008, which lies safely below the minor psychological support of 4010 and the recent consolidation lows. Our profit target is placed at 4035 to capitalize on the expected acceleration once the level at 4016 breaks. This setup yields a highly favorable reward-to-risk ratio of approximately 2:1, justifying the risk-on posture.
투자 권유가 아닌 참고 정보예요. 매매 판단과 책임은 본인에게 있어요.