BTCUSD 매수 분석
- 신뢰도
- 75
- 진입
- 63,384
- 목표
- 64,115
- 손절
- 62,785
- 공개일
- 2026-08-02
요약
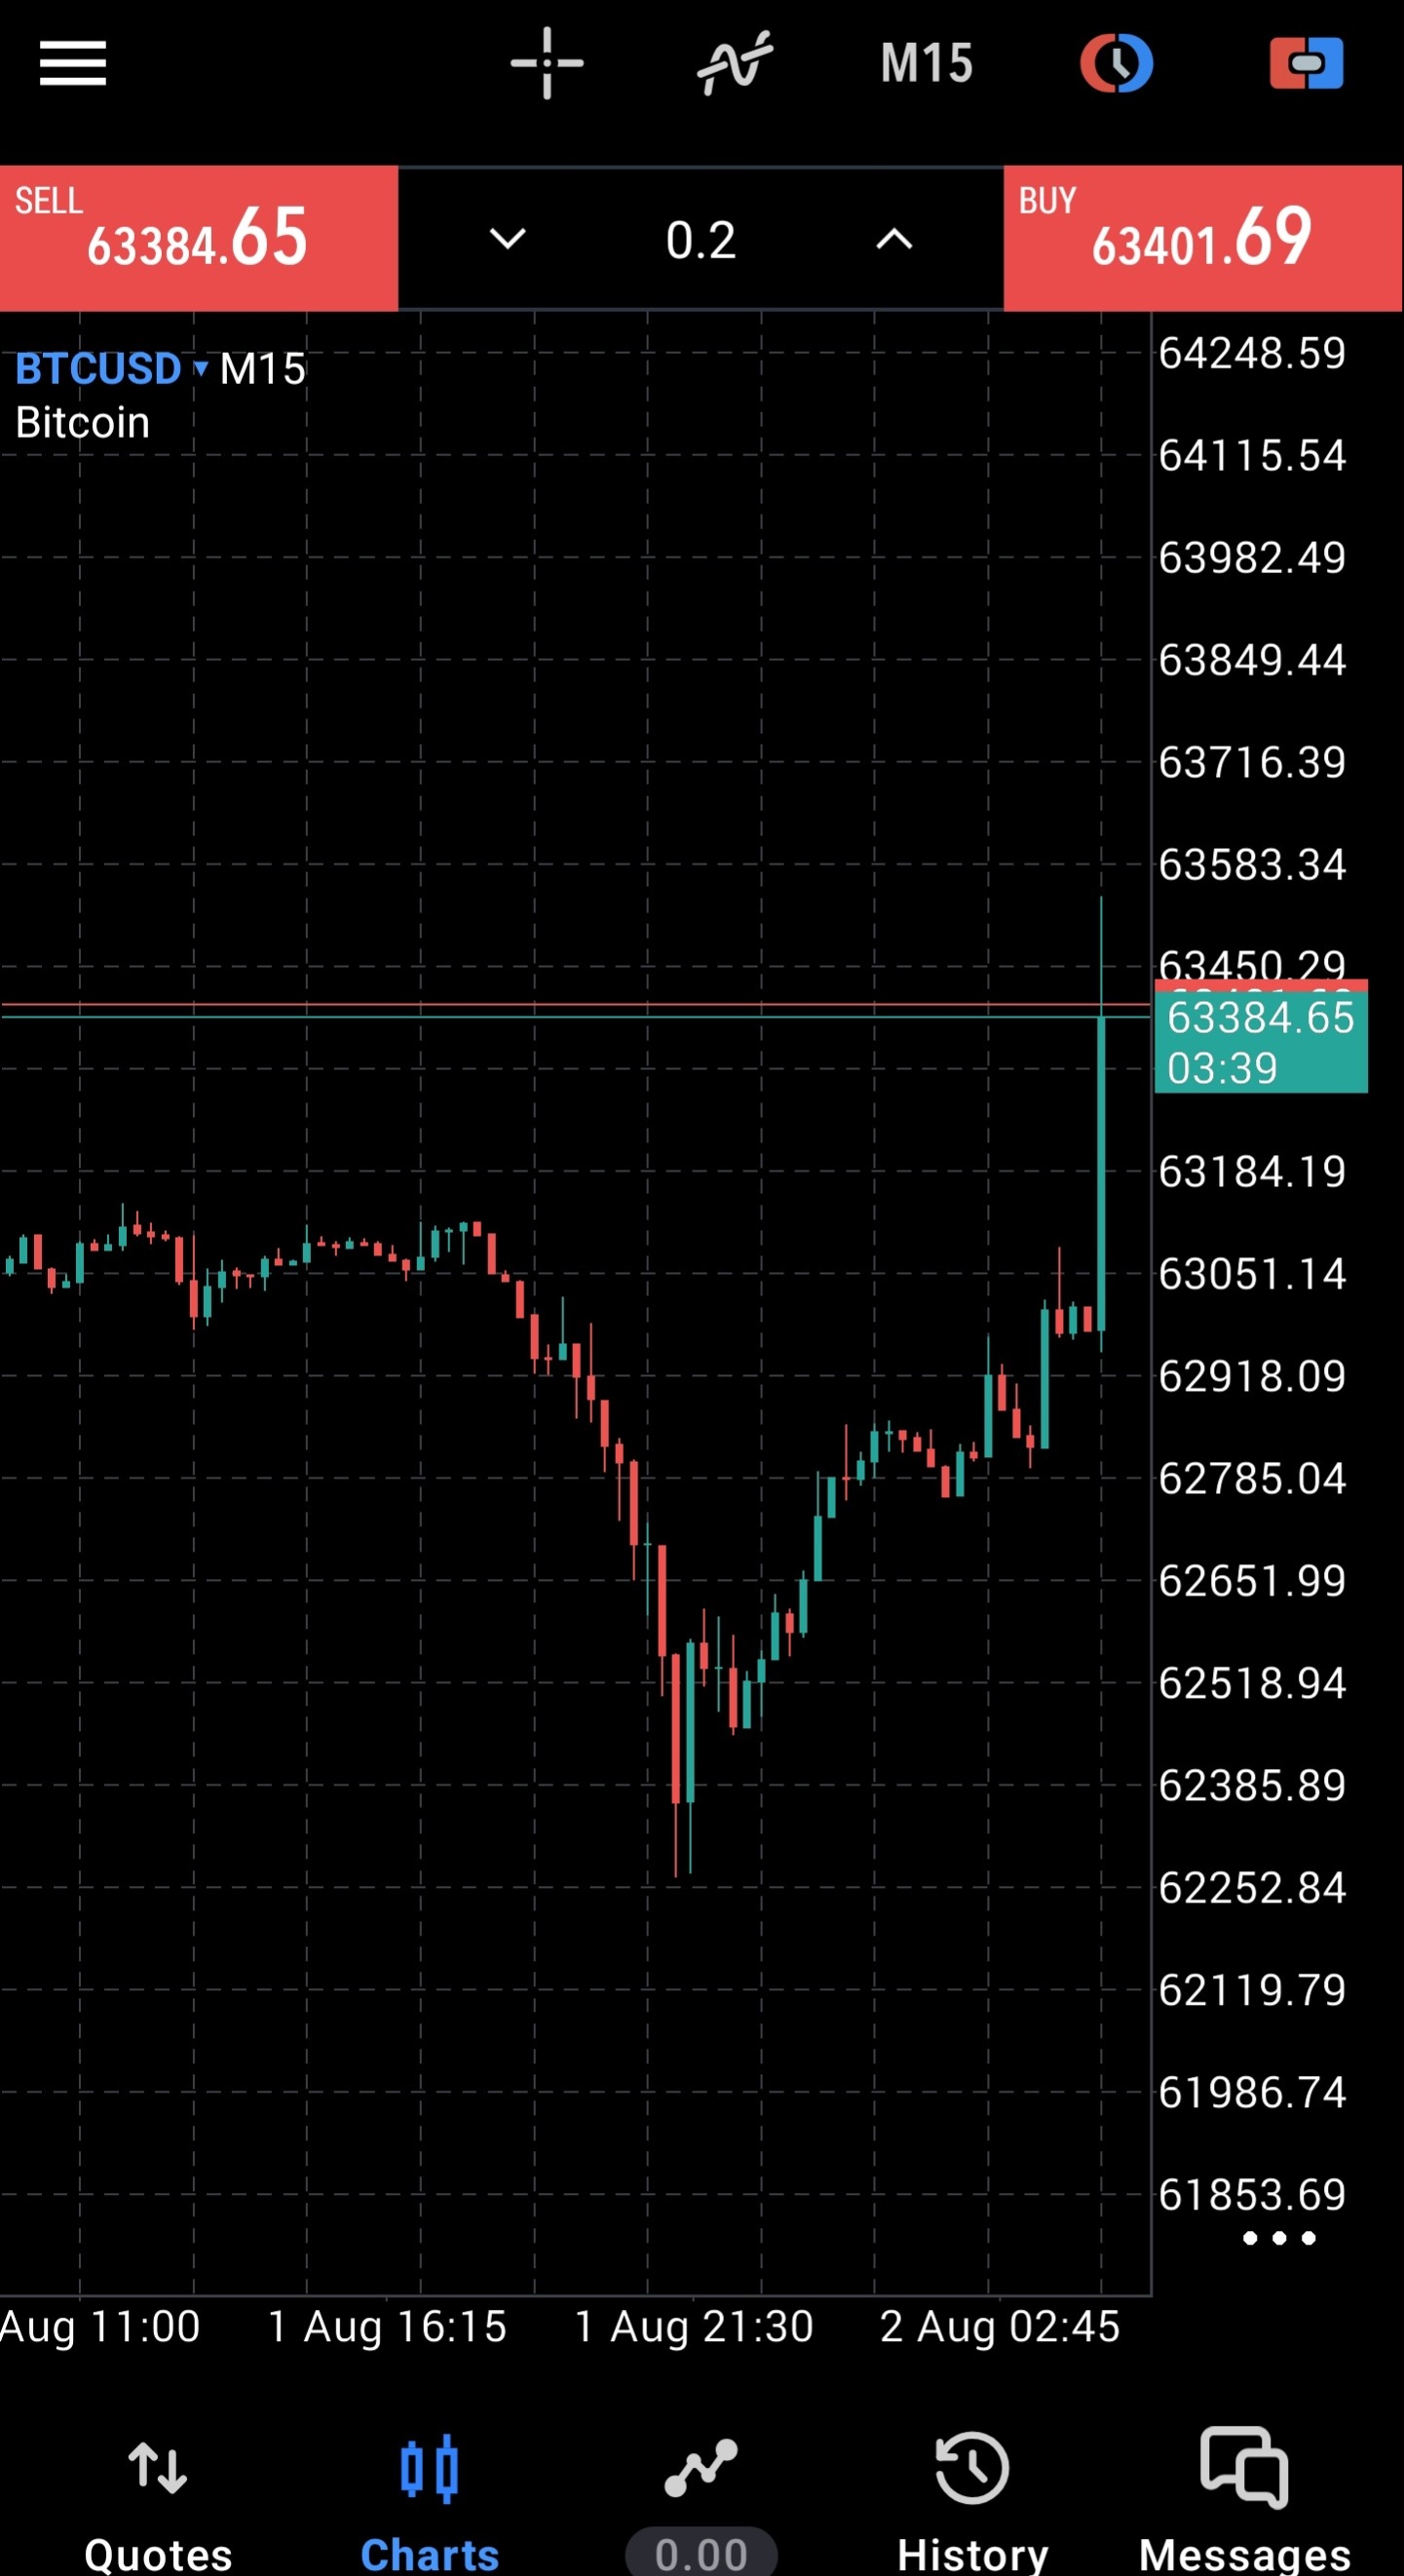
Bitcoin (BTCUSD) has staged a powerful V-shaped recovery on the 15-minute timeframe, culminating in a violent bullish expansion candle that broke above previous resistance levels. The explosive buying volume implies strong short-term upward momentum likely to test overhead resistance near 64115.
추세
The short-term trend on the M15 timeframe has abruptly shifted from a sharp sell-off to a strong uptrend following a capitulation low at 62252.84. Price surged over 1,300 points (+2.1%) in a very short duration, clearing multiple intermediate swing highs around 62918 and 63051. The momentum is heavily bullish as long as price stays above the breakout base at 62918.09. A drop back below 62518 would fully invalidate this immediate bullish recovery thesis.
패턴
The price action reveals a classical V-bottom reversal pattern formed between August 1st 21:30 and August 2nd 02:45. Following a period of tight consolidation around 62918-63051, a massive bullish expansion candle materialized, spiking above 63583.34. This aggressive impulse wick indicates significant buying pressure and market orders absorbing short liquidity above 63400.
지표
Traditional technical indicators such as RSI, MACD, and moving averages are not explicitly plotted on this raw candlestick display. However, reading directly from price action and candle structure, the extremely large green candle body and long upper shadow demonstrate intense short-term volatility and buying pressure. Volume and price velocity clearly skew heavily in favor of the bulls for an immediate momentum continuation.
전략
Look to enter a long position around current market levels near 63384 on a slight pullback or consolidation. Set a stop loss just below the recent higher-low structure at 62785 to limit downside risk. Target the higher time-frame resistance region near 64115 for a solid risk-to-reward setup.
투자 권유가 아닌 참고 정보예요. 매매 판단과 책임은 본인에게 있어요.