AUDCAD 매도 분석
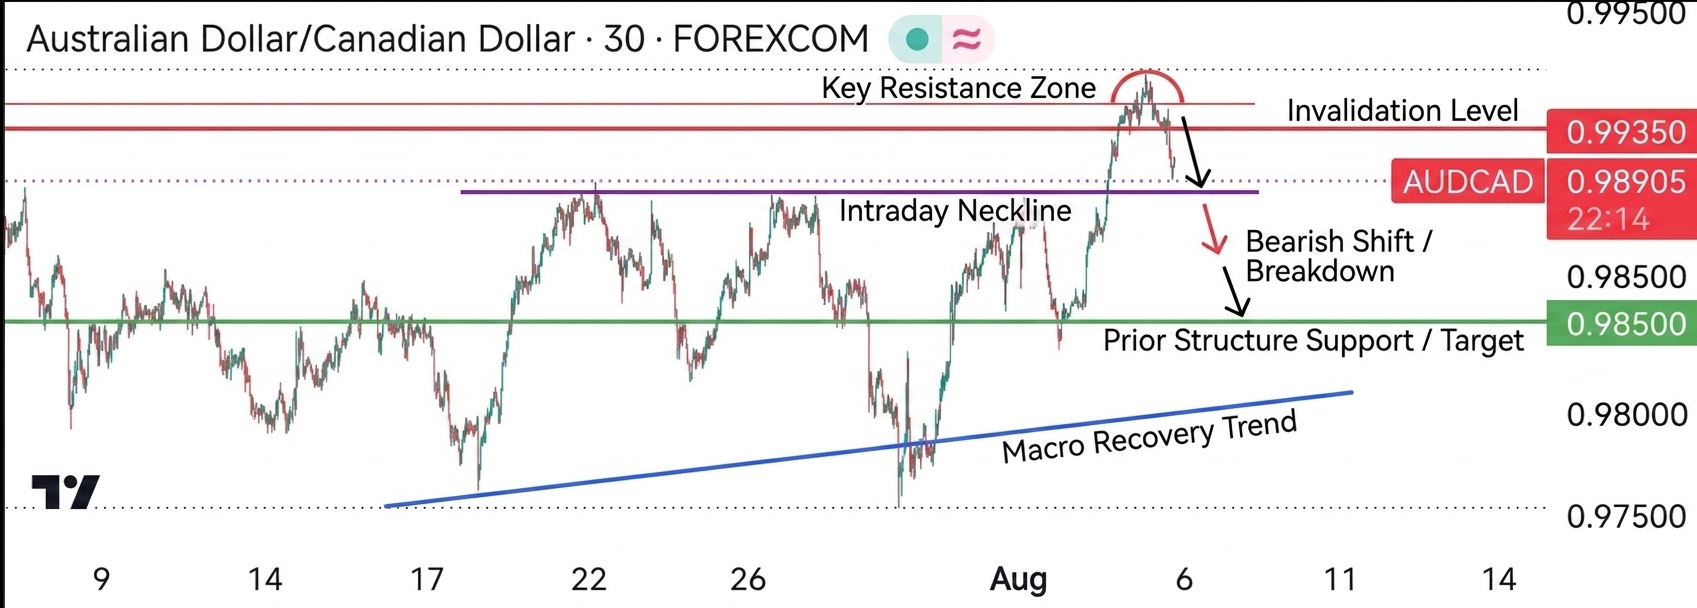
- 신뢰도
- 75
- 진입
- 0.98905
- 목표
- 0.98500
- 손절
- 0.99350
- 공개일
- 2026-08-06
요약
AUD/CAD has staged a strong rally up to key resistance near 0.99300, but has just printed a sharp rejection and a short-term lower high/breakdown on the 30-minute timeframe. A pull-back towards prior structure support around 0.98500 is expected before any further upside.
추세
The pair has been in a macro recovery from the multi-week lows near 0.97500 in late July, making higher highs and higher lows into early August. However, after peaking slightly above 0.99200, momentum stalled abruptly and price rapidly broke back below the 0.99000 round-number level. The immediate short-term trend on this 30-minute chart has flipped from bullish to bearish as red candles expand downward. The bullish trend structure would be fully invalidated on a break below 0.98500, but current price action favours a downward corrective phase.
패턴
A classic Double Top / Blow-off Top structure has formed around the 0.99200-0.99300 zone, evidenced by sharp rejection wicks followed by consecutive strong bearish candles. Price has broken below the immediate intraday necklines near 0.99000, signaling that sellers have taken control of short-term order flow. If this local breakdown holds, the measured move target points toward the previous consolidation shelf near 0.98500. A push above 0.99350 would invalidate this double top pattern.
지표
Moving averages and traditional momentum indicators such as RSI and MACD are not explicitly overlaid on this chart view. However, price action shows sharp bearish momentum with expanding red candlestick bodies cutting through local support levels. Volume indicator is not visible on the chart. The strong rejection from 0.99300 implies overbought conditions were reached prior to this sharp reversal.
전략
Look to initiate a short position on a minor pullback towards 0.98950 - 0.99000, targeting the key horizontal support level around 0.98500. Place a tight stop loss above the recent swing high at 0.99350 to maintain a favorable risk-to-reward ratio above 1:2. Risk should be managed carefully as the higher timeframe structure had been trending up until this top formed.
투자 권유가 아닌 참고 정보예요. 매매 판단과 책임은 본인에게 있어요.