BNB 매도 분석
- 신뢰도
- 75
- 진입
- 720.1
- 목표
- 719.0
- 손절
- 721.5
- 공개일
- 2026-08-18
요약
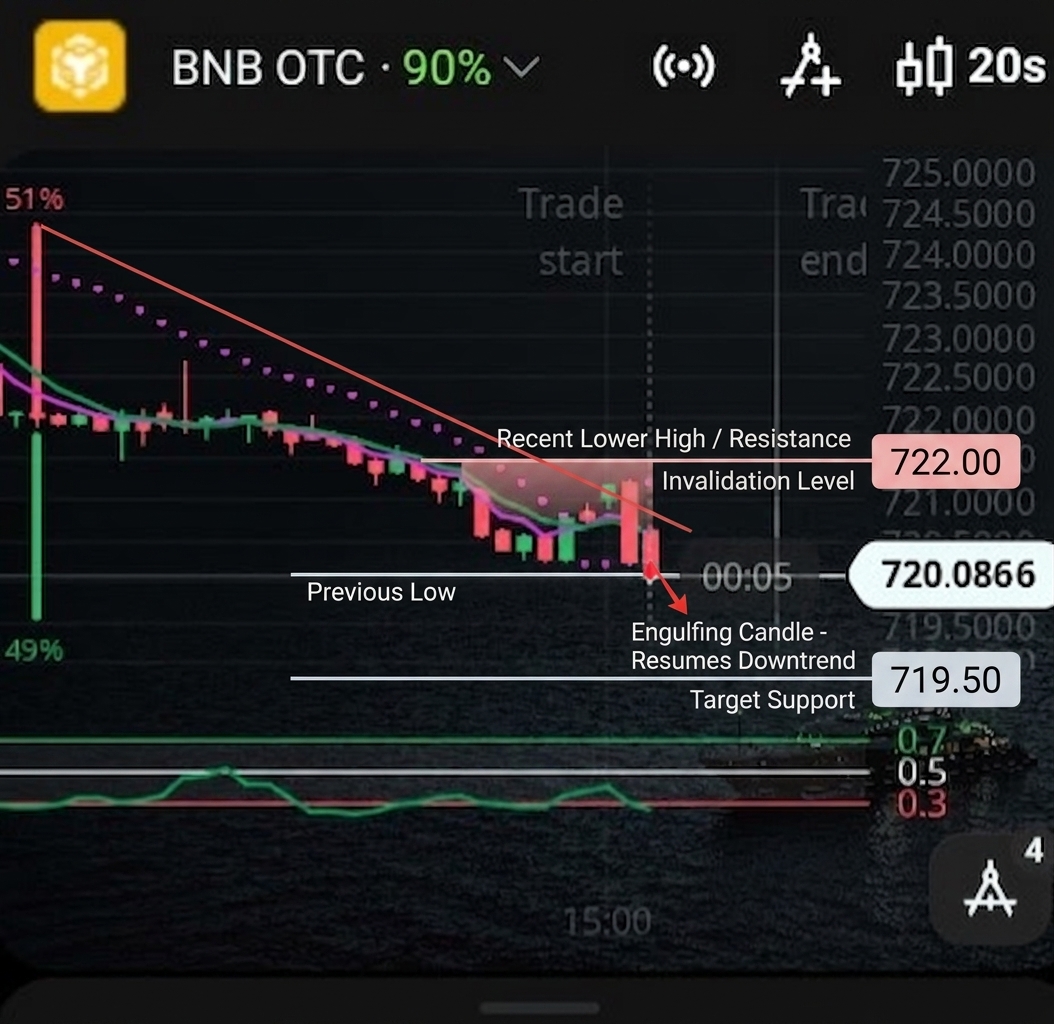
BNB OTC is currently in a clear short-term downtrend on the 20-second timeframe, characterized by lower highs and lower lows. A brief pull-back toward 721.20 was quickly rejected by strong selling pressure, pointing to a continuation towards lower support levels.
추세
The short-term trend is strongly bearish across the displayed period, falling from above 724.00 down to the current 720.08 level. The moving averages are clearly aligned in a negative slope, holding above price and acting as dynamic resistance. The pink dotted indicator (Parabolic SAR / trailing stop line) remains steadily positioned above the price action, reinforcing that bears control the immediate momentum. A break above 722.00 would be required to invalidate this dominant downward trajectory.
패턴
The chart exhibits a classical bearish continuation sequence on ultrashort timeframes. Following a sharp leg down to approximately 720.50, price formed a temporary weak bounce that formed a lower high near 721.30. The most recent 20-second candle is a solid red body engulfing the previous bullish micro-candles, signaling the resumption of the primary downtrend towards psychological support around 719.50.
지표
The upper chart display shows moving averages tightly clustered above price near 720.80, forming immediate resistance. The pink trailing dot indicator sits above current price levels at approximately 721.80, indicating a ongoing short bias. The oscillator displayed in the sub-chart (normalized bounded indicator) is declining toward the lower threshold of 0.3, showing strong bearish momentum without yet reaching extreme oversold conditions.
전략
Consider opening a short or 'Down' position on the current pullback completion near 720.10. Initial downside target is set around the support level of 719.00, while a strict stop loss should be placed above the recent swing high at 721.50 to limit risk on unexpected reversals.
투자 권유가 아닌 참고 정보예요. 매매 판단과 책임은 본인에게 있어요.