MUBARAKUSDT 매도 분석
- 신뢰도
- 75
- 진입
- 0.02311
- 목표
- 0.01950
- 손절
- 0.02550
- 공개일
- 2026-08-19
요약
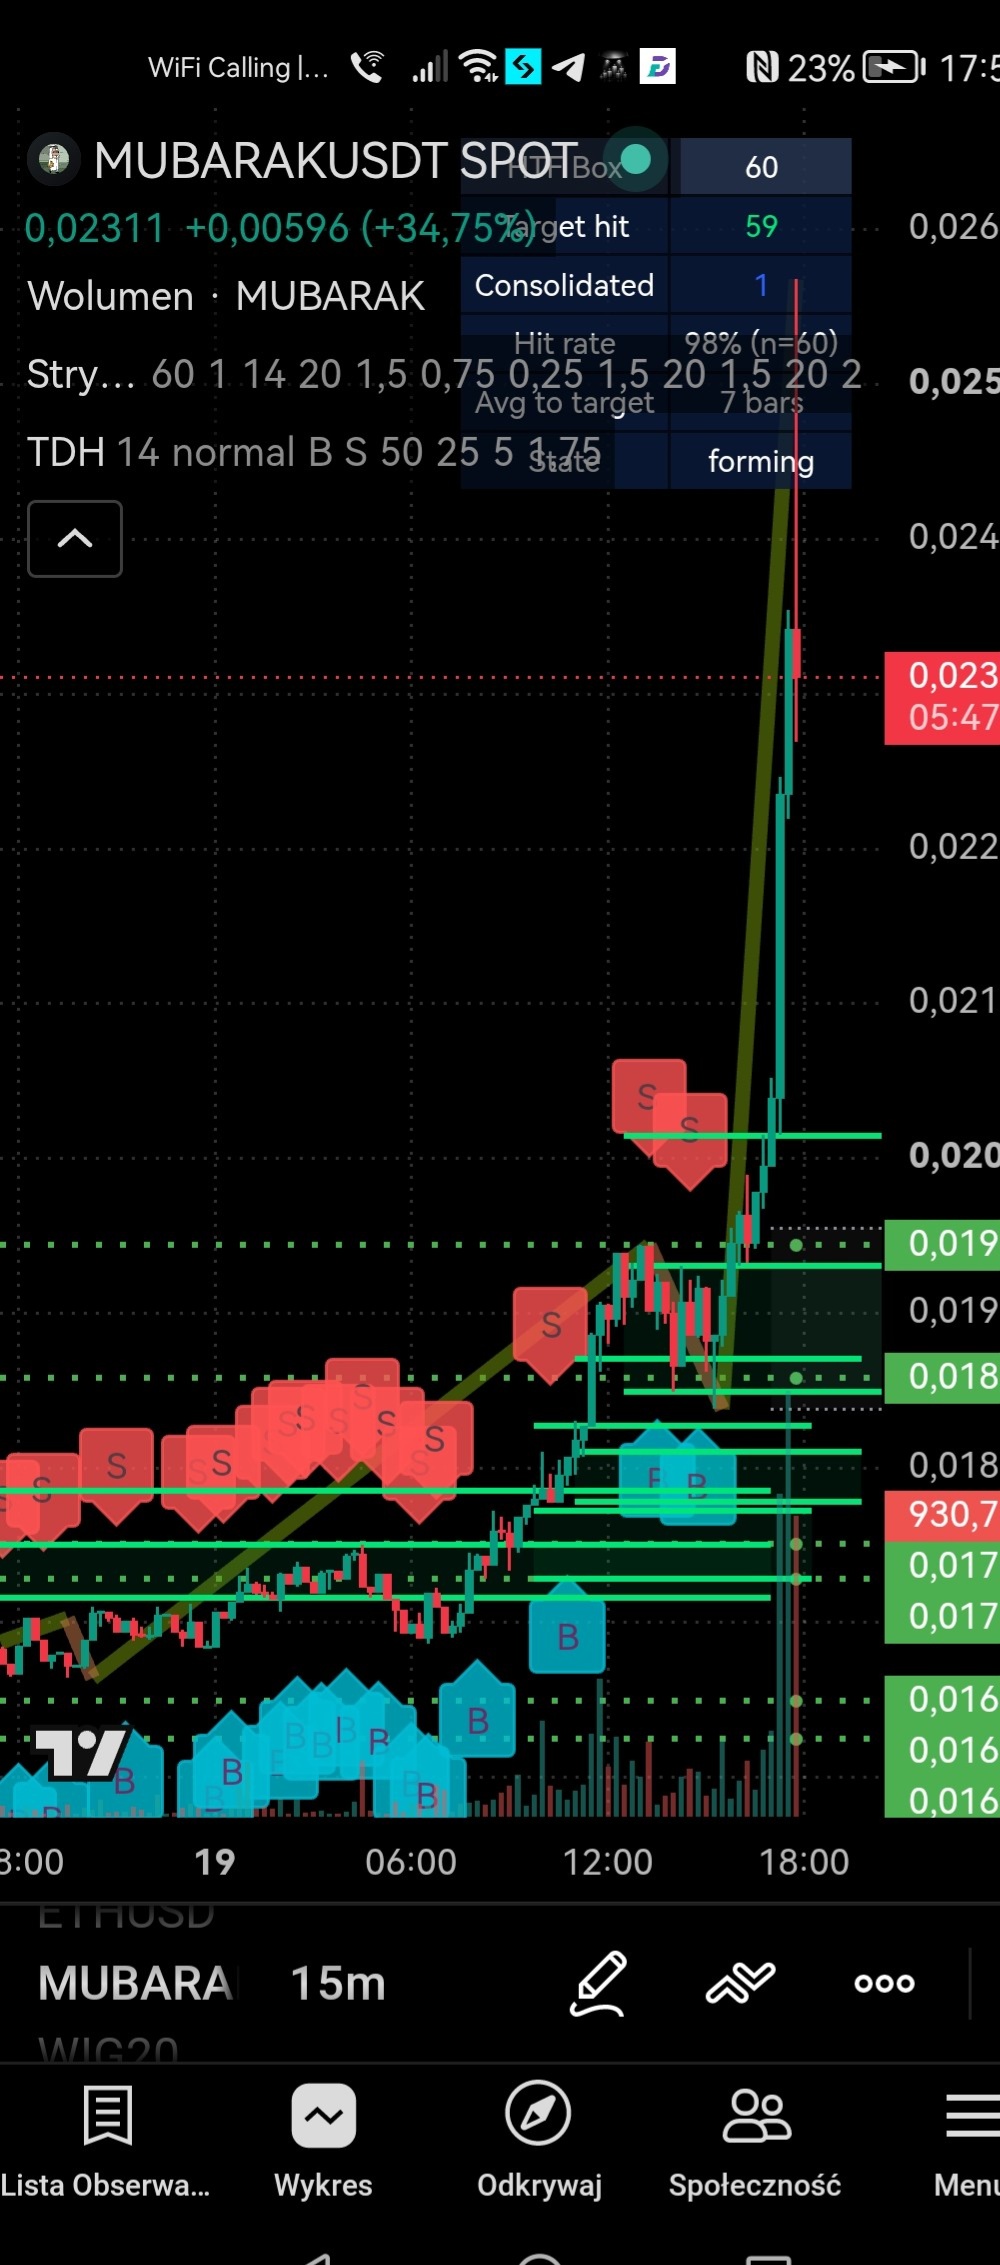
MUBARAKUSDT has experienced an extreme vertical parabolic spike reaching a high above 0.0255 before encountering immediate, heavy selling pressure. The strong upper wick indicates severe exhausted buying momentum and a likely short-term pullback toward underlying support zones.
추세
The asset demonstrated a steady uptrend throughout the session, which culminated in a massive vertical surge of over +34.75% reaching a peak near 0.0258. This sharp expansion away from the baseline support levels around 0.0180-0.0200 represents a parabolic expansion that is statistically unsustainable without a significant retracement. A drop below the local breakout level of 0.0203 would completely invalidate the short-term vertical momentum and signal a deeper correction. Given the steepness of the rally, moving averages are heavily lagged far below current price action, suggesting price is highly stretched.
패턴
The price action displays a classic blow-off top / parabolic spike pattern on the 15-minute timeframe. A large bullish candle pushed aggressively through prior resistance levels before meeting heavy overhead supply, resulting in a long upper rejection shadow. This formation highlights an aggressive liquidity sweep where early buyers are taking profits and sellers are overwhelming remaining bids. If the current bar closes near its lows, it forms a bearish shooting star/pin bar signaling immediate downside reversal potential.
지표
Volume surged dramatically during the breakout candle, confirming climax volume typical of exhaustion tops. The price is drastically elevated above prior consolidation bands near 0.0185 and 0.0203, which now serve as primary support targets below. Custom buy/sell strategy signals on the chart previously flashed multiple 'S' (sell) indicators near lower highs and now show state 'forming' near extreme extensions, signaling high risk for late buyers. Traditional momentum metrics would reflect extreme overbought conditions well above 80 on short timeframes.
전략
Given the extreme volatility and rejection at 0.0258, the optimal play is taking profits on long positions or taking a speculative short on relief bounces. Traders should look for short entries near the current level around 0.02311 or retests near 0.02400. A tight stop loss should be placed above the recent swing high at 0.02550 to manage risk effectively against further parabolic spikes. Downside profit targets are set sequentially at major horizontal consolidation levels of 0.02030 and 0.01880.
투자 권유가 아닌 참고 정보예요. 매매 판단과 책임은 본인에게 있어요.