GRVTUSDT 매수 분석
- 신뢰도
- 75
- 진입
- 0.325
- 목표
- 0.360
- 손절
- 0.305
- 공개일
- 2026-08-19
요약
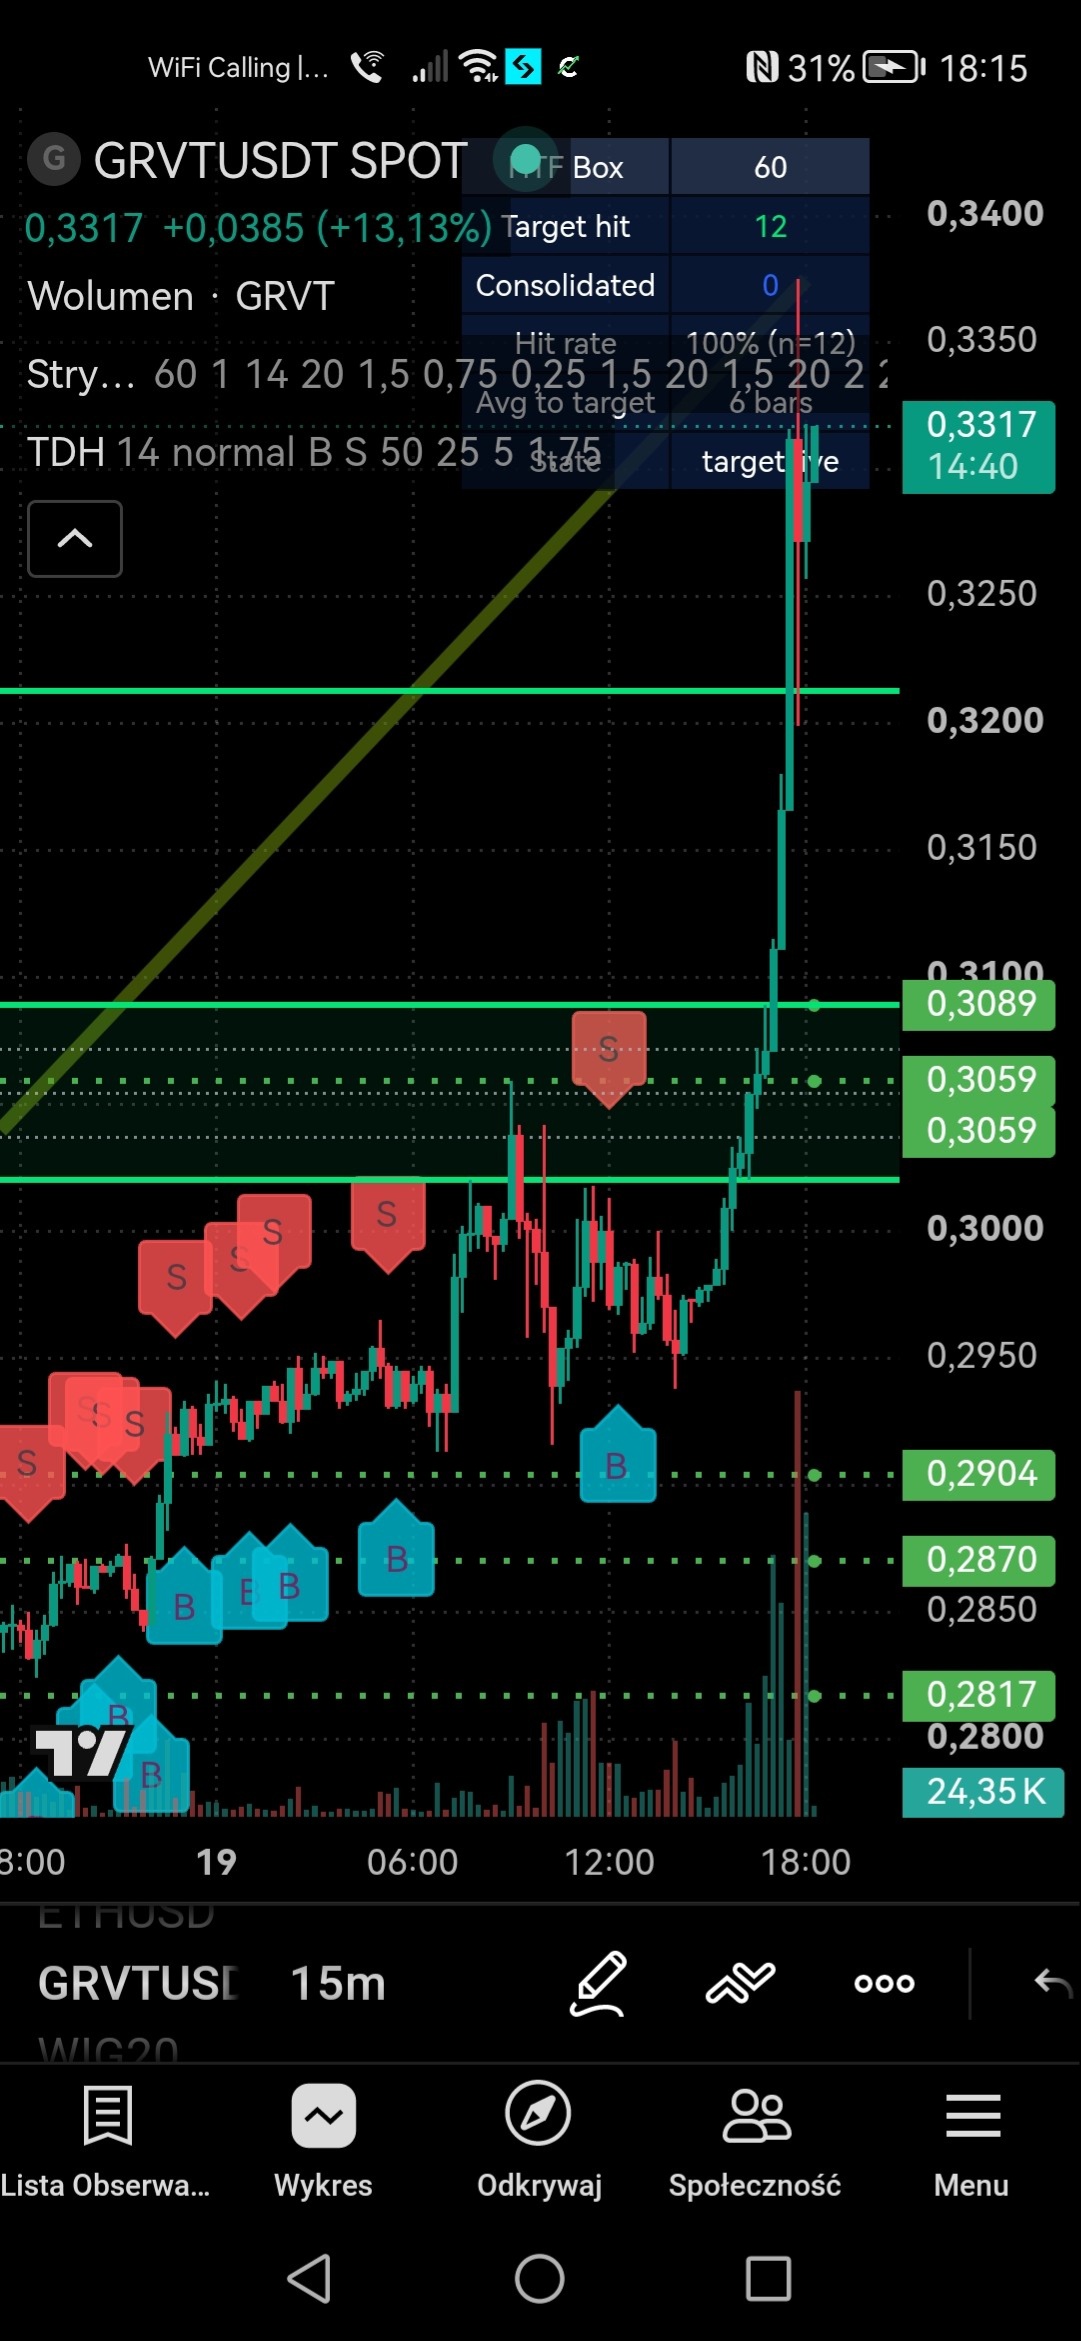
GRVTUSDT exhibits an intense parabolic breakout (+13.13%) clearing several major horizontal resistance levels, supported by a massive spike in buy volume. A slight retracement or entry around the broken resistance provides a high-probability continuation setup towards higher targets.
추세
The asset has transitioned from a sideways consolidation phase around 0.2900-0.3050 into a strong explosive uptrend. The move has generated over a 13% gain in a short timeframe, breaking key multi-hour resistance levels at 0.3059 and 0.3210. A steep upward trend line confirms dominant bullish momentum. The primary trend remains strongly bullish as long as price stays above the 0.3059 breakout zone.
패턴
The chart shows a classic horizontal range breakout followed by a sharp expansion candle. Price consolidated below 0.3059 before delivering a impulsive momentum move up past 0.3300. Although the current top candle shows a minor upper wick indicating short-term profit taking, the overall structure remains extremely bullish with clear higher highs.
지표
Volume shows a massive, noticeable spike matching the explosive green candle, confirming heavy buying interest and institutional presence. Automated Buy (B) signals preceded the breakout near 0.2904, validating the trend direction. Oscillator indicators like RSI/MACD are not explicitly paneled, but the raw price action and volume expansion clearly signify an overbought yet highly momentum-driven environment.
전략
Look for a limit or market entry around 0.3250 to catch a potential shallow pull-back following the spike, or ride momentum toward the 0.3600 level. Place a stop loss below the immediate support zone at 0.3050 to limit downside risk. Target the psychological and technical expansion zone around 0.3600 for a favorable risk-to-reward setup.
투자 권유가 아닌 참고 정보예요. 매매 판단과 책임은 본인에게 있어요.