US30Cash 매수 분석
- 신뢰도
- 75
- 진입
- 53,600
- 목표
- 53,650
- 손절
- 53,550
- 공개일
- 2026-08-26
요약
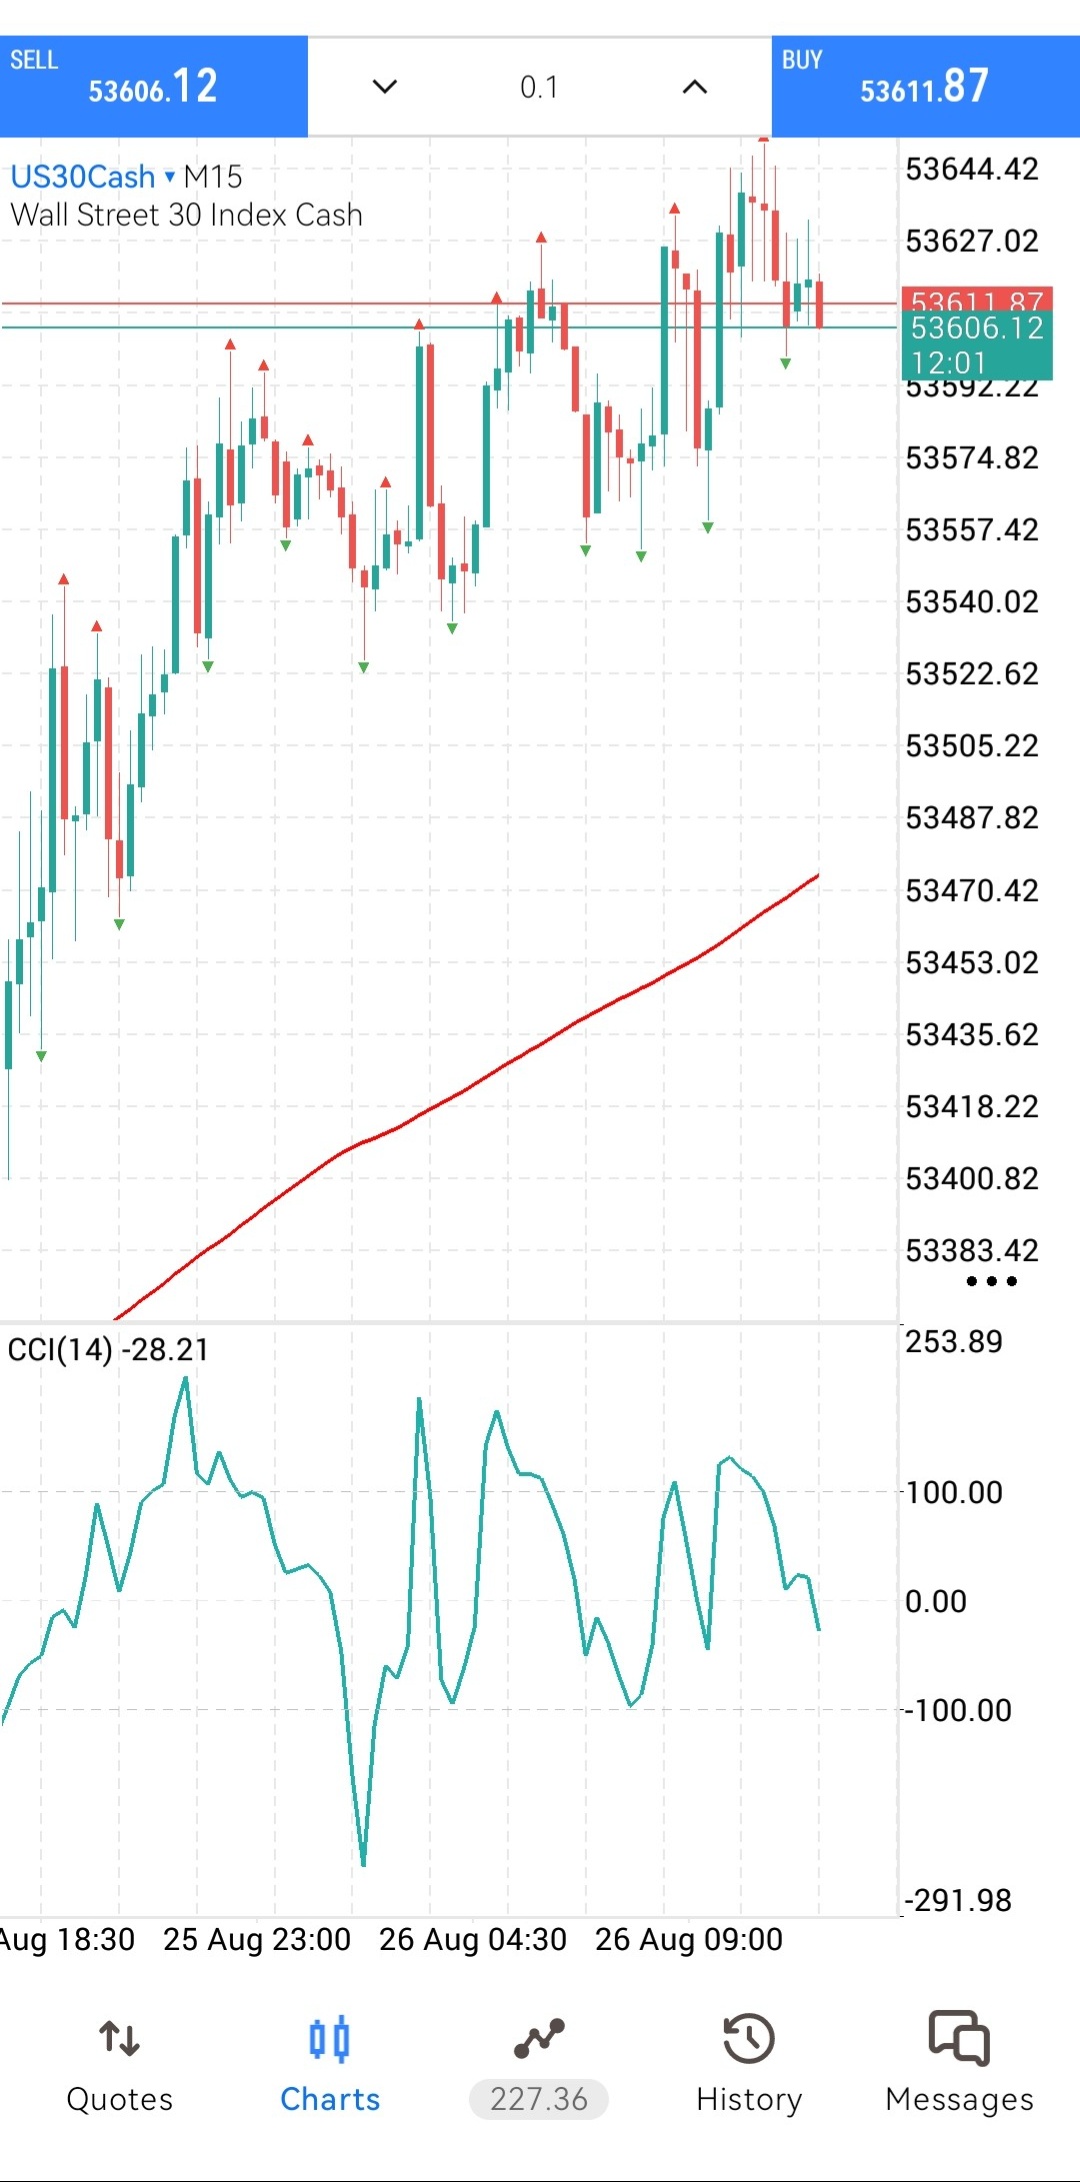
The US30Cash index is exhibiting a solid intraday uptrend on the 15-minute chart, characterized by a series of higher highs and higher lows above a strongly sloped moving average. The current minor pullback towards the 53600 support zone offers an attractive dip-buying opportunity in line with the broader bullish momentum.
추세
The 15-minute chart displays a persistent bullish trend that originated below the 53380 level and expanded toward a peak above 53644. Price action remains comfortably above the long-term moving average line, currently sloped upwards near 53470, confirming robust underlying buying pressure. The market structure continues to make higher highs and higher lows across multiple sessions. This primary bullish direction remains valid as long as prices hold above the recent swing low around the 53550 level.
패턴
The chart shows a classic ascending structure with bullish price action breaking out past prior resistance near 53592 and reaching a high above 53644. The current red candles represent a standard pull-back retest of the broken breakout structure around 53600-53606. Small green buy-arrows generated by internal fractals confirm persistent demand whenever the index dips. A successful hold at this retest zone targets a re-expansion back toward the recent high and beyond.
지표
The primary indicator displayed is the Commodity Channel Index (CCI 14), which currently reads approximately -28.21. The CCI has pulled back from overbought levels (>100) down towards the zero-line area, indicating that excess bullish momentum has cooled without shifting into oversold or severe bearish territory. Volume indicators are not explicitly displayed on this MetaTrader chart setup. Overall, the CCI behavior aligns well with a standard health-check pullback during an established rally.
전략
Look to enter a long position near the current support zone around 53600 to capitalize on the continuation of the trend. Set a protective stop loss below the recent structural swing low at 53550 to limit downside risk if momentum breaks down. The primary take-profit target is set at 53650, near and slightly above the recent high around 53644. Maintain proper position sizing to manage volatility inherent in short-term index trading.
투자 권유가 아닌 참고 정보예요. 매매 판단과 책임은 본인에게 있어요.