TUSDT 매도 분석
- 신뢰도
- 75
- 진입
- 0.004998
- 목표
- 0.004300
- 손절
- 0.005400
- 공개일
- 2026-09-02
요약
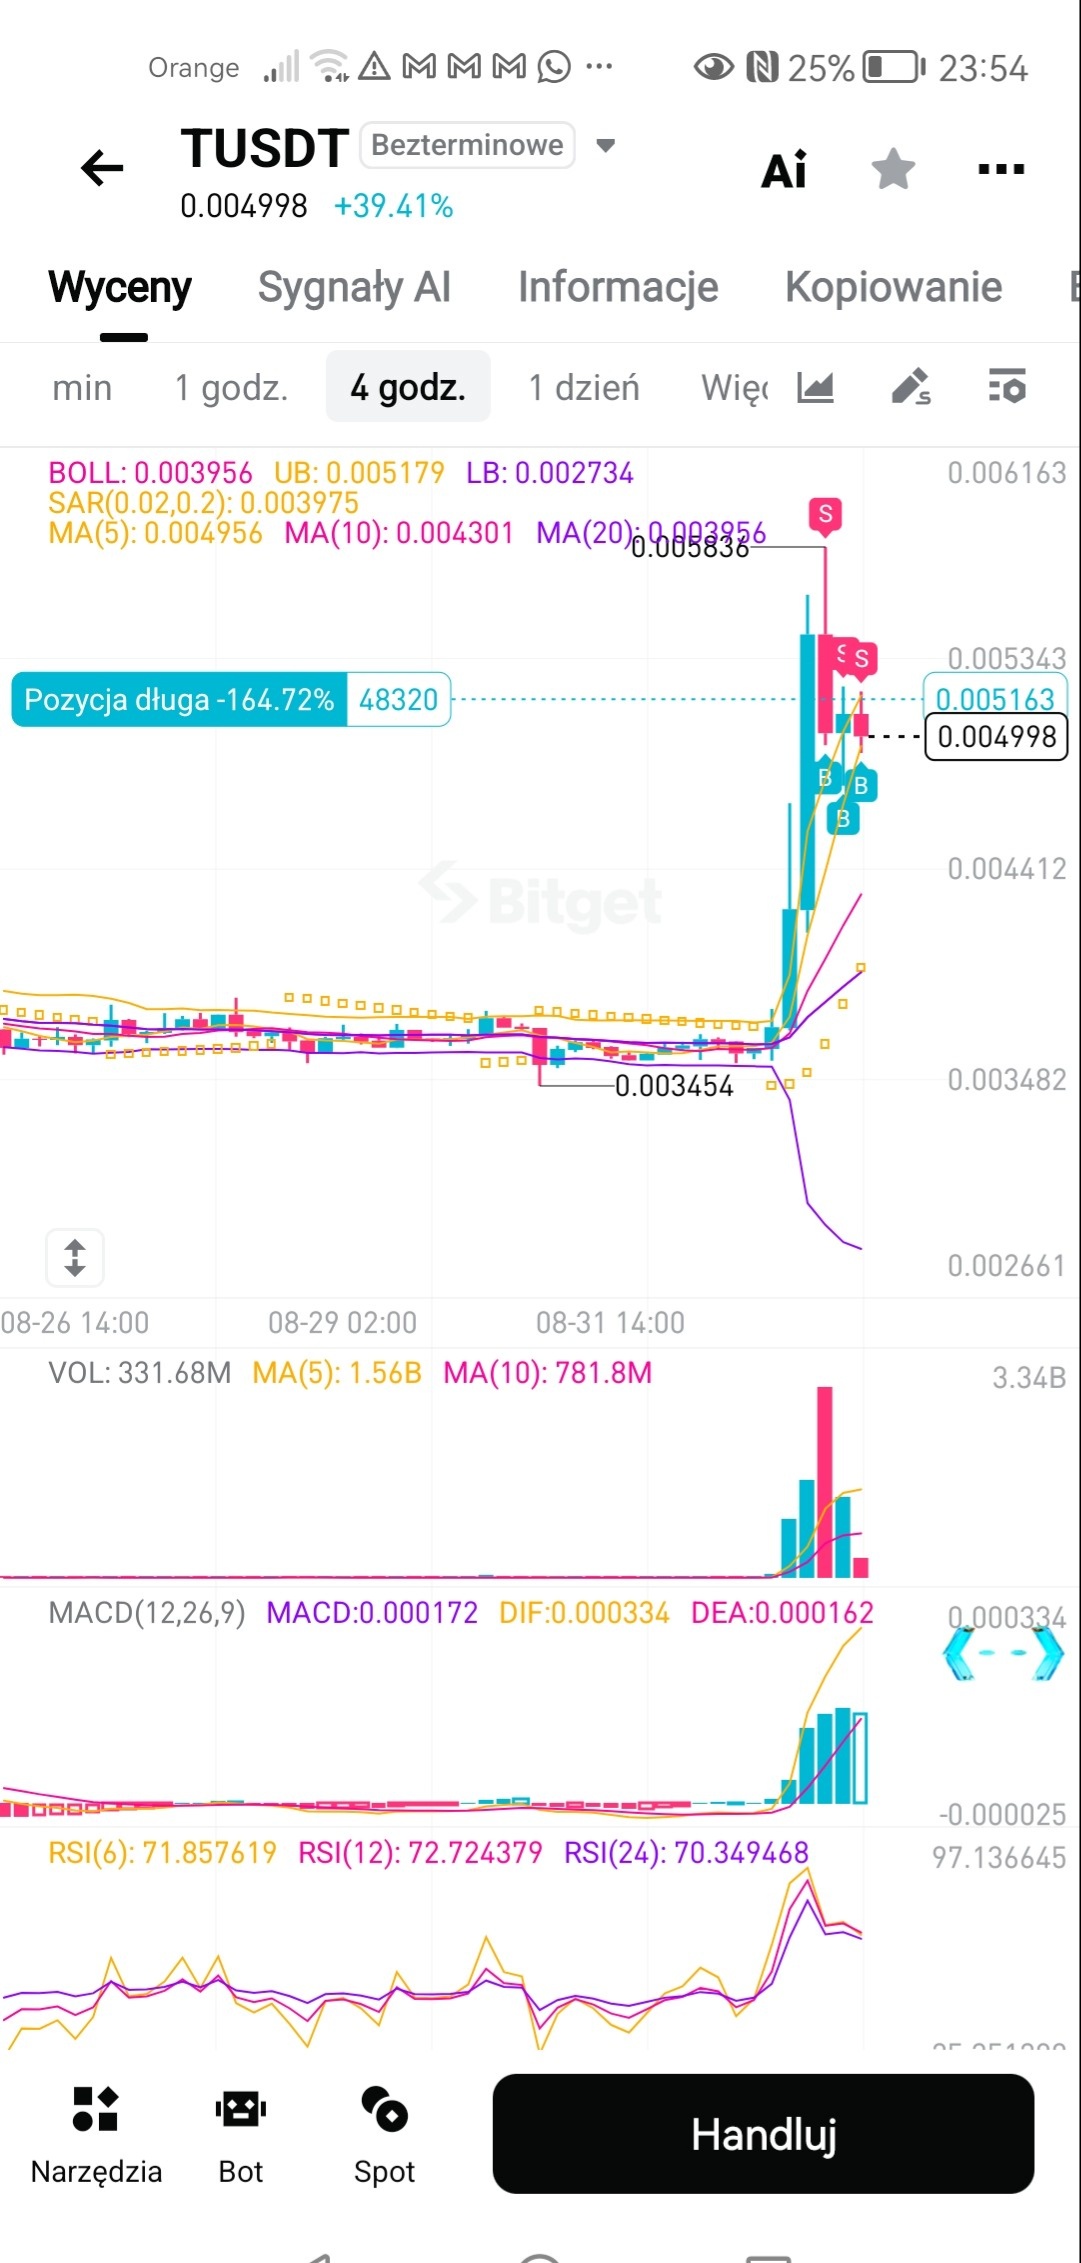
TUSDT experienced a massive parabolic breakout exceeding +39% in a short duration, reaching a high of 0.005836 before suffering sharp rejection wicks. Given the extreme overbought conditions across multiple time-based indicators and significant distance from mean moving averages, a substantial corrective pullback toward key support levels is expected.
추세
The 4-hour chart displays a sudden, highly aggressive bullish expansion out of a tight consolidation base around 0.003454. The price is currently trading at 0.004998, well above the 20-period moving average at 0.003956 and 10-period moving average at 0.004301. While the immediate trend structure is technically strong, the parabolic slope is unsustainable in the short term. A break below the MA(5) at 0.004956 would confirm the onset of a deeper mean-reversion phase toward the MA(10) or MA(20) levels.
패턴
The price action formed a dramatic vertical pump reaching a peak local resistance at 0.005836, followed immediately by prominent upper shadow wicks on consecutive 4-hour candles. This candlestick formation signals aggressive profit-taking and selling pressure near the highs. Furthermore, the price has failed to sustain above the upper Bollinger Band (0.005179), creating an engulfing pull-back structure characteristic of a blow-off top formation.
지표
The technical indicator suite highlights severe overextension. The RSI readings are deeply in overbought territory, with RSI(6) at 71.86, RSI(12) at 72.72, and RSI(24) at 70.35, all sloping downward from recent peaks. The MACD remains positive (DIF: 0.000334, DEA: 0.000162, Histogram: 0.000172), but volume has begun decreasing from the peak candle of 3.34B, indicating diminishing buying momentum at these elevated prices.
전략
The optimal tactical approach is to lock in profits on existing long positions or initiate a counter-trend short/fade entry near current market levels around 0.004998. Position risk should be strictly managed with a stop loss placed above the upper rejection shadow near 0.005400. Target a corrective retracement down toward the rising 10-period moving average support at approximately 0.004300.
투자 권유가 아닌 참고 정보예요. 매매 판단과 책임은 본인에게 있어요.