USD/BRL 매수 분석
- 신뢰도
- 85
- 진입
- 0.20018
- 목표
- 0.20060
- 손절
- 0.19980
- 공개일
- 2026-09-06
요약
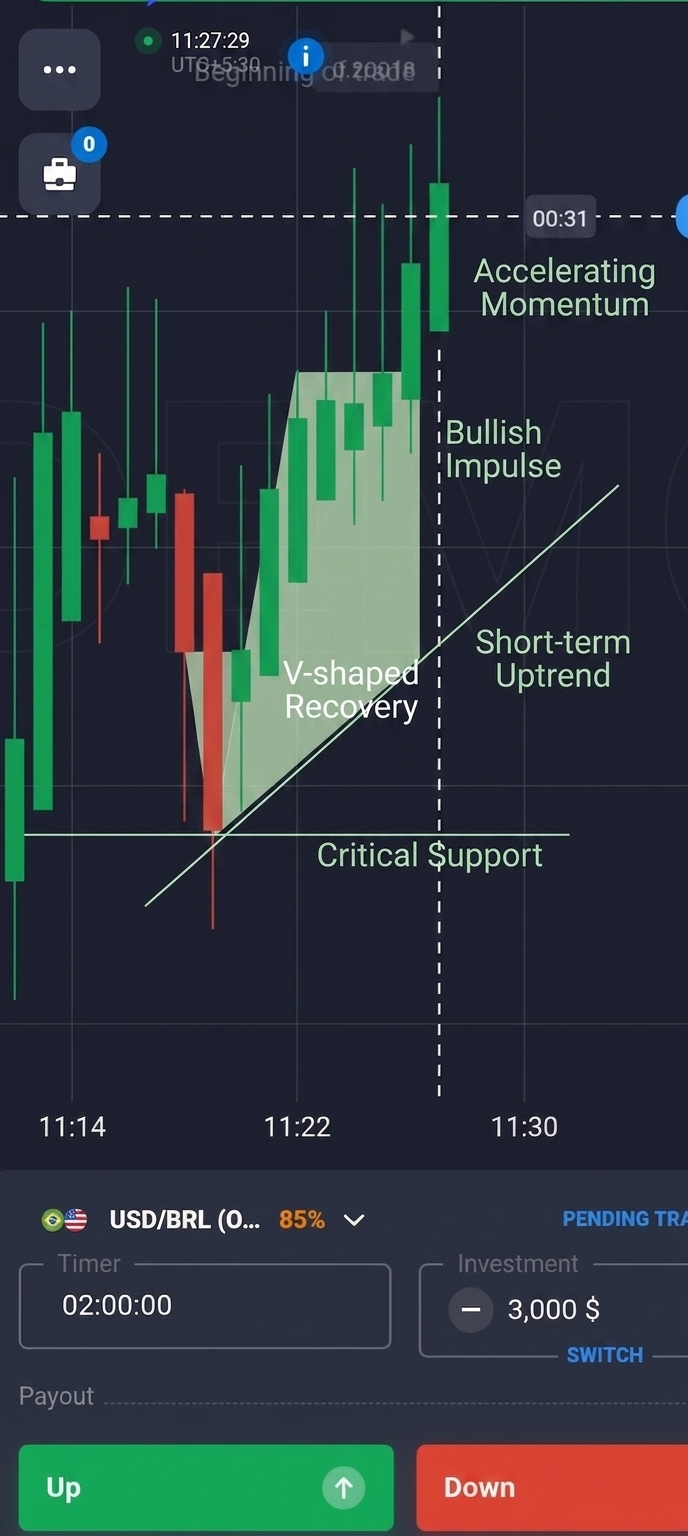
The USD/BRL chart shows a strong short-term bullish momentum featuring consecutive large green candlesticks breaking higher. Buyers remain firmly in control as price consistently makes higher highs and higher lows.
추세
The market displays a distinct ultra-short-term uptrend starting from the swing low formed around 11:20. Over the subsequent 8 to 10 minutes, the price has steadily surged upwards with strong green bodies. The momentum is accelerating as the latest candles are closing near their highs, showing little to no upper wick resistance. A reversal of this short-term trend would only be triggered if price breaks back below the recent consolidated swing low around the 11:22 candle region.
패턴
A clear bullish impulse pattern is visible, characterized by consecutive bullish marubozu-like candles on short timeframes. After a brief red pullback around 11:20 to 11:22, a V-shaped recovery ensued, taking out previous local highs and creating an expansion phase. There are no immediate reversal candlestick patterns such as shooting stars or evening stars formed yet.
지표
Standard technical indicators like RSI or MACD are not explicitly overlaid on this interface view. However, price action itself shows strong relative strength, with price printing expanding real bodies indicating high momentum. Volume indicators are unavailable on this display, but the vertical price expansion reflects high buying activity.
전략
Look to join the strong bullish trend by taking a long/Up position on minor pullbacks or directly on continuation. Given the short binary/options timeframe displayed, riding the immediate momentum offers the highest probability. Manage risk by setting tight invalidation right below the previous candle's low.
투자 권유가 아닌 참고 정보예요. 매매 판단과 책임은 본인에게 있어요.