BTCUSD 매수 분석
- 신뢰도
- 70
- 진입
- 79,688
- 목표
- 79,950
- 손절
- 79,500
- 공개일
- 2026-09-06
요약
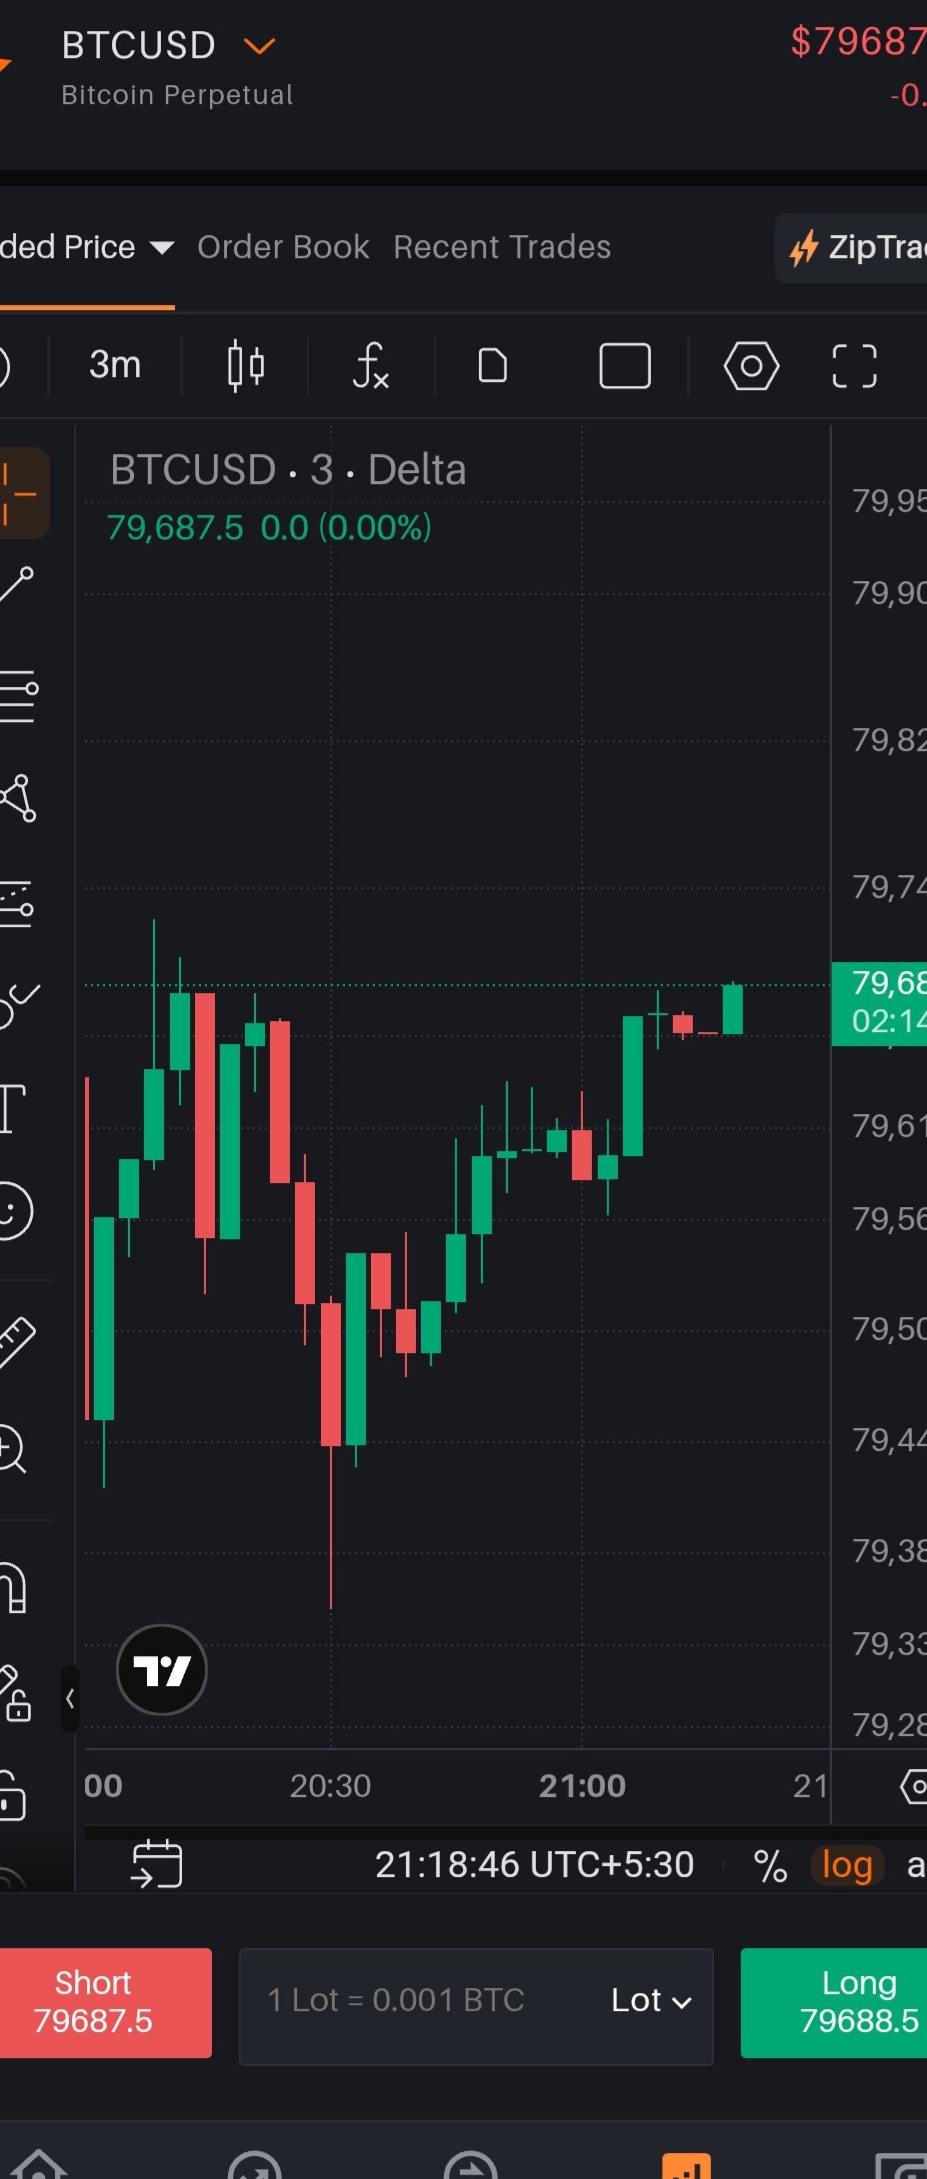
BTCUSD is exhibiting short-term bullish momentum on the 3-minute chart after finding strong support near 79,350 and making higher highs toward 79,700.
추세
The 3-minute chart shows a clear recovery from a local bottom established around the 79,350 level at approximately 20:30. Price action subsequently formed a sequence of higher lows and higher highs, climbing above the local resistance cluster near 79,650. The momentum remains upwards in the immediate term as green candles dominate the recent advance toward the 79,687.5 level. An invalidation of this short-term bullish trend would occur on a sharp breakdown back below the swing low at 79,440.
패턴
A 'V-shaped' recovery pattern followed by a bullish flag/consolidation is visible between 20:30 and 21:00. The price found a sharp rejection tail at 79,350, indicating strong buying interest at lower levels. A small bullish consolidation range formed near 79,600 before breaking out to current high levels near 79,687.5. The measured move target from this minor breakout points toward the psychological 80,000 resistance level.
지표
Oscillators such as RSI and MACD are not overlaid on this clean chart view. Price action itself displays robust momentum with expanding green bodies compared to the small red pullback candle prior to the latest move. Volume overlay is not explicitly enabled, but the rapid recovery spikes indicate significant aggressive buying off the low. Price is holding comfortably above all prior intraday micro-resistance levels.
전략
Look for a long entry around current market levels or on a slight pullback to the former resistance turned support near 79,650. Place a tight stop loss just below the recent higher low structure at 79,500 to maintain a favorable risk-to-reward ratio. Take profit targets should be set conservatively around 79,950 to 80,000 near major round-number resistance.
투자 권유가 아닌 참고 정보예요. 매매 판단과 책임은 본인에게 있어요.