XAUUSD 매도 분석
- 신뢰도
- 85
- 진입
- 4,162
- 목표
- 4,145
- 손절
- 4,175
- 공개일
- 2026-10-02
요약
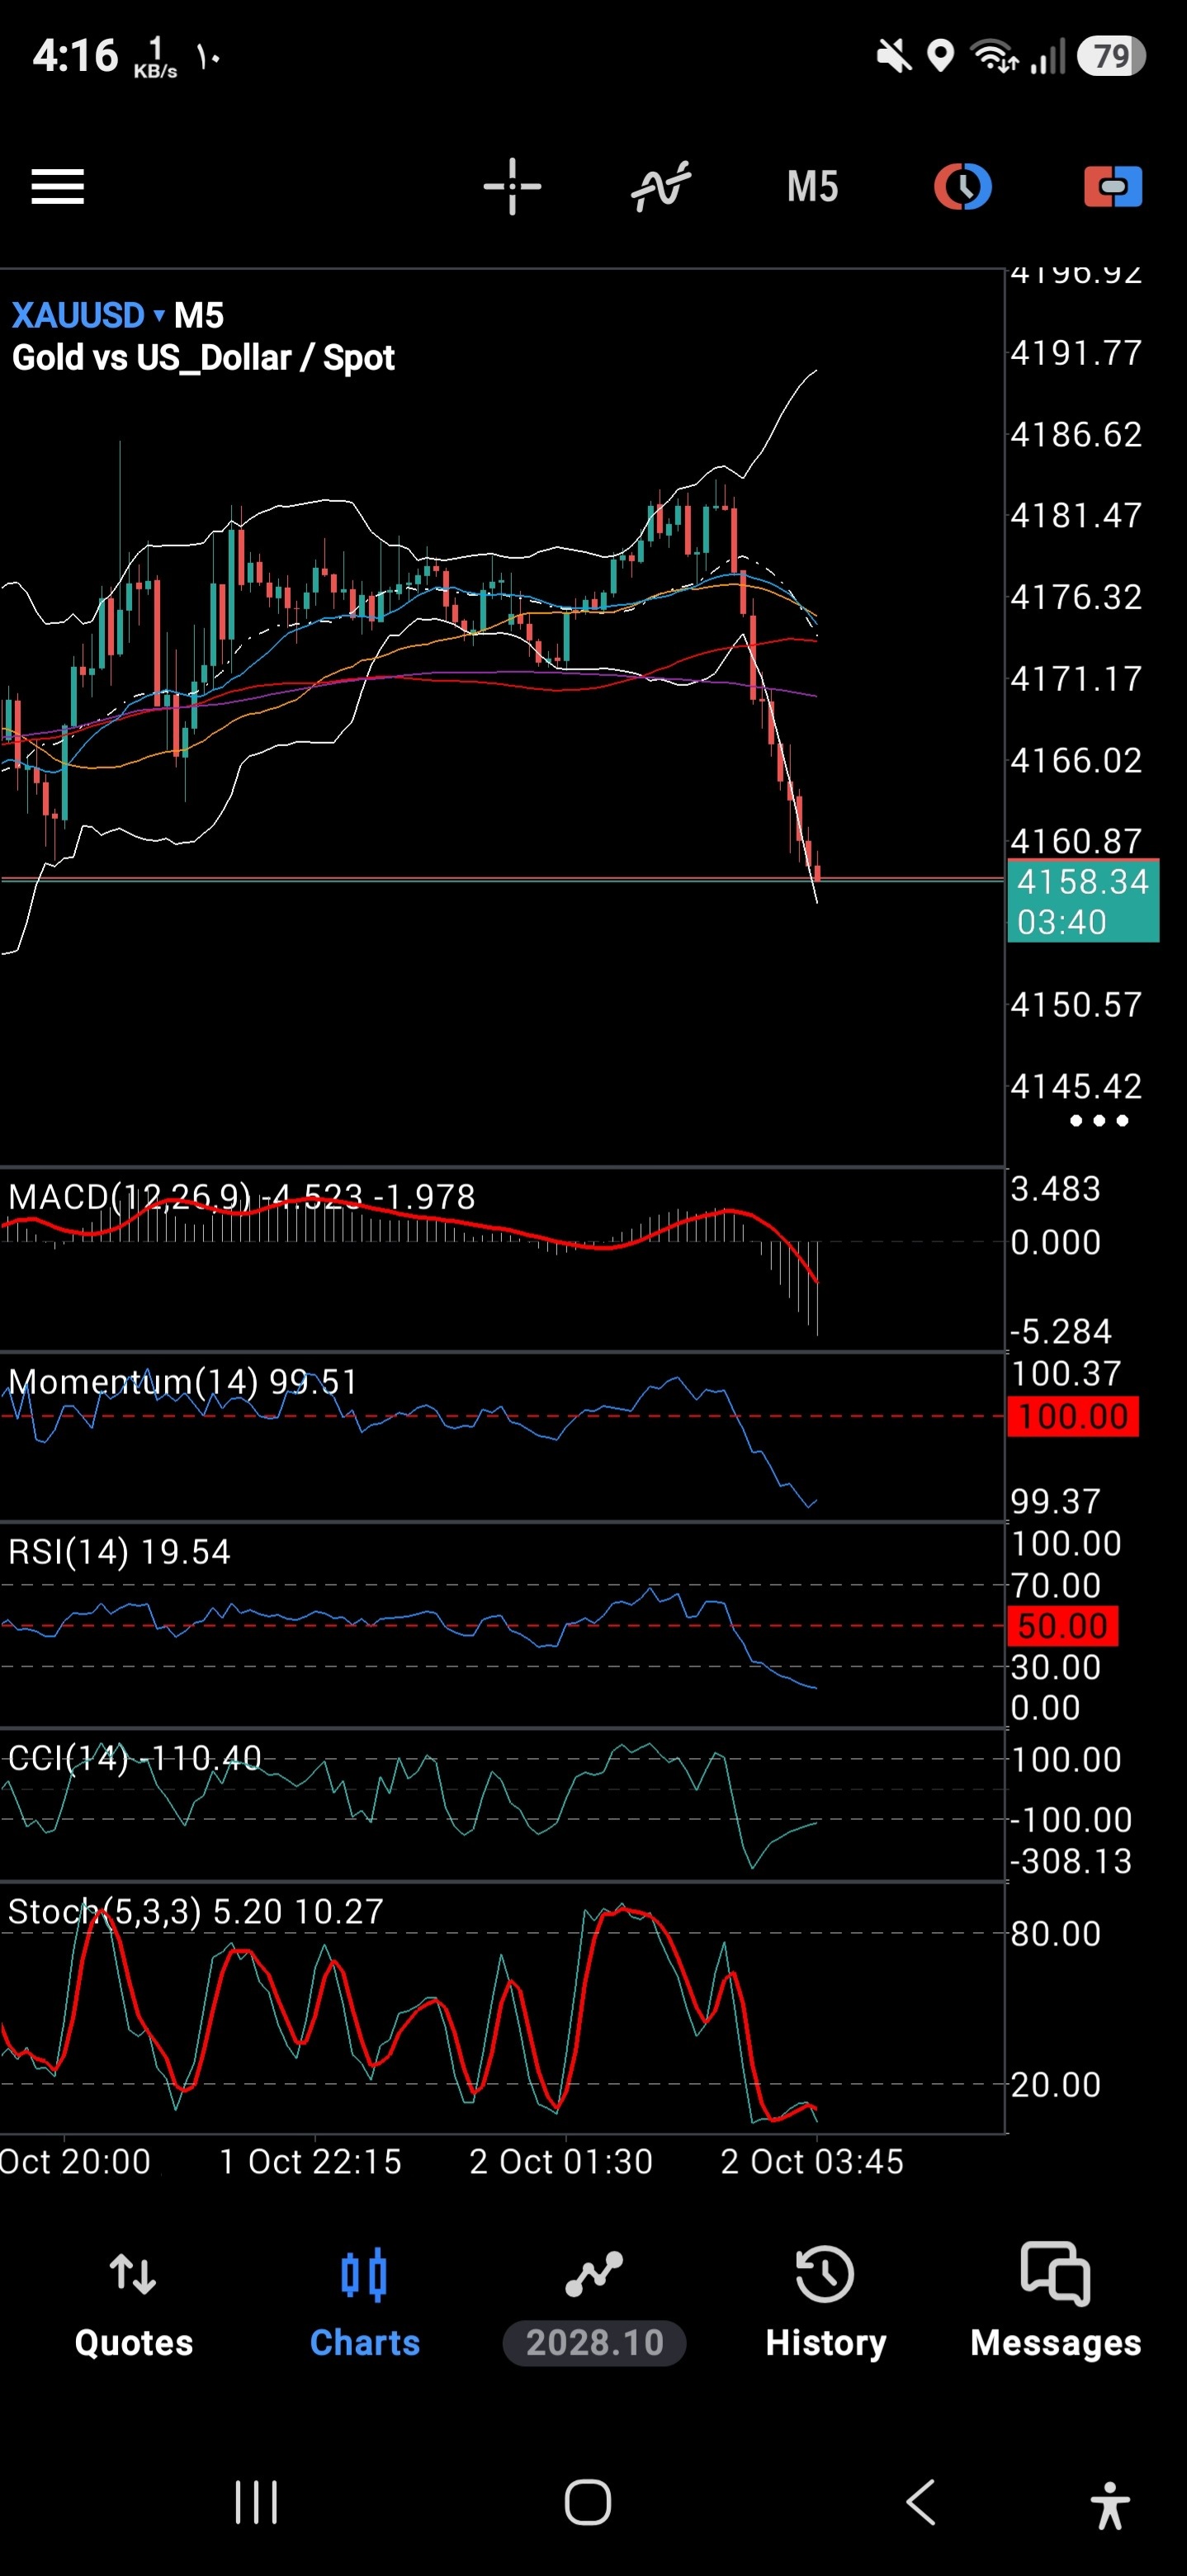
Gold (XAUUSD) on the M5 chart exhibits a severe short-term breakdown below key moving averages and the lower Bollinger Band. Strong downside momentum across all oscillators signals persistent selling pressure.
추세
The short-term 5-minute trend has transitioned into an aggressive downtrend after failing at the 4185.00 resistance area. Price has collapsed below all short- and medium-term moving averages, breaking through former horizontal support at 4171.00. The rapid sequence of long red candles indicates aggressive institutional selling, with the trend remaining strongly bearish as long as price stays below the 4171.00 resistance level.
패턴
A clear double-top/head-and-shoulders distribution pattern formed between 4181.00 and 4185.00 prior to the sell-off. The subsequent breakdown beneath the 4171.00 neckline confirmed the pattern completion. The impulse move expanded the lower Bollinger Band significantly, signaling a high-volatility breakdown phase that typically offers continuation to lower liquidity levels.
지표
The technical indicators are universally aligned to the downside. The MACD histogram has expanded deeply into negative territory with a value of -4.523, displaying no signs of bullish divergence. RSI(14) stands deeply oversold at 19.54, while Stochastic(5,3,3) sits near bottom levels at 5.20/10.27, reflecting extreme short-term momentum in favor of sellers. Momentum(14) has breached the critical 100.00 threshold down to 99.51, and CCI(14) is depressed at -110.40.
전략
Given the strength of the impulse, traders should look to enter short positions on minor pullbacks toward the broken support turned resistance at 4166.00 or market price. A stop loss should be placed safely above the recent moving average cluster at 4175.00, with downside targets set at major dynamic support near 4145.00.
투자 권유가 아닌 참고 정보예요. 매매 판단과 책임은 본인에게 있어요.