차트 매도 분석
- 신뢰도
- 75
- 진입
- 4,163.99
- 목표
- 4,148.62
- 손절
- 4,169.13
- 공개일
- 2026-10-19
요약
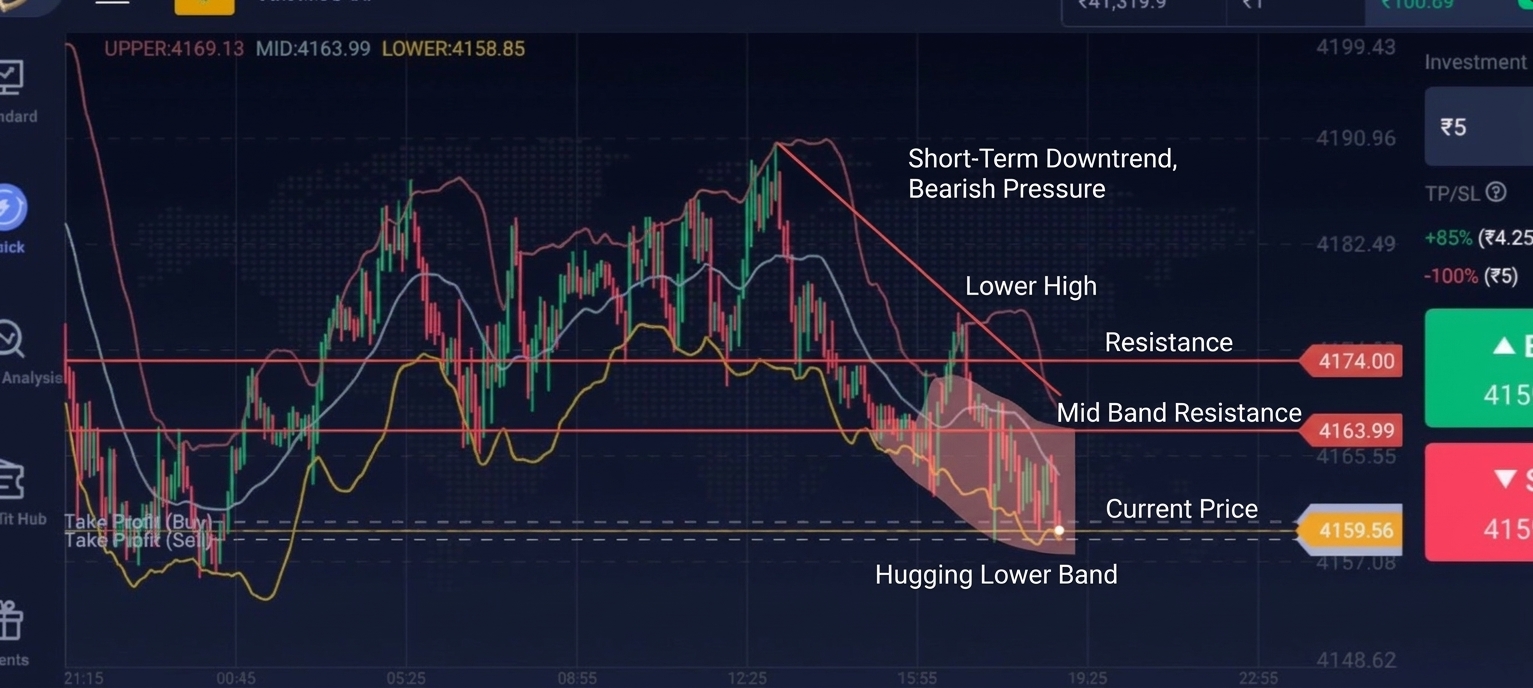
The asset is in a clear short-term downtrend, making lower highs and lower lows from its peak near 4190 down to its current level near 4159. Price action is hugging the lower Bollinger Band, signaling strong bearish continuation pressure.
추세
The overall price action shows a established downward trend since peaking near 4190.10 around 12:25. Price is currently trading at 4159.56, well below the middle Bollinger Band average line of 4163.99, confirming strong sell-side momentum. The slope of the middle band is pointing downwards, reinforcing the strength of this intraday downtrend. A trend invalidation would require a decisive breakout back above the middle band at 4163.99 and resistance around 4174.00.
패턴
The chart exhibits a classic head-and-shoulders/rounded top distribution pattern around the peak near 4190. Following the breakdown, consecutive bearish candles have formed along the lower boundary of the channel. Recent candles demonstrate persistent selling pressure with minimal lower wicks, indicating sellers maintain firm control. The failure to sustain any bounce above 4174 confirms a lower-high structure.
지표
The Bollinger Bands are showing expanded volatility with UPPER at 4169.13, MID at 4163.99, and LOWER at 4158.85. The current spot price of 4159.56 is pressing against the lower band (4158.85), which indicates high downside momentum ('walking the band'). Volume indicators and momentum oscillators are not explicitly plotted, but the band distance and slope confirm strong negative momentum.
전략
Look to enter short positions on minor pullbacks toward the middle Bollinger Band near 4163.99 or on a breakdown below the current lower band of 4158.85. Set a strict stop-loss just above the middle band at 4169.13 to manage risk against a temporary oversold bounce. Target the lower historical support region near 4148.62 for take-profit.
투자 권유가 아닌 참고 정보예요. 매매 판단과 책임은 본인에게 있어요.