BTCUSD Hold analysis
- Confidence
- 75
- Entry
- 66,885
- Target
- 67,150
- Stop
- 66,600
- Published
- 2026-06-23
Summary
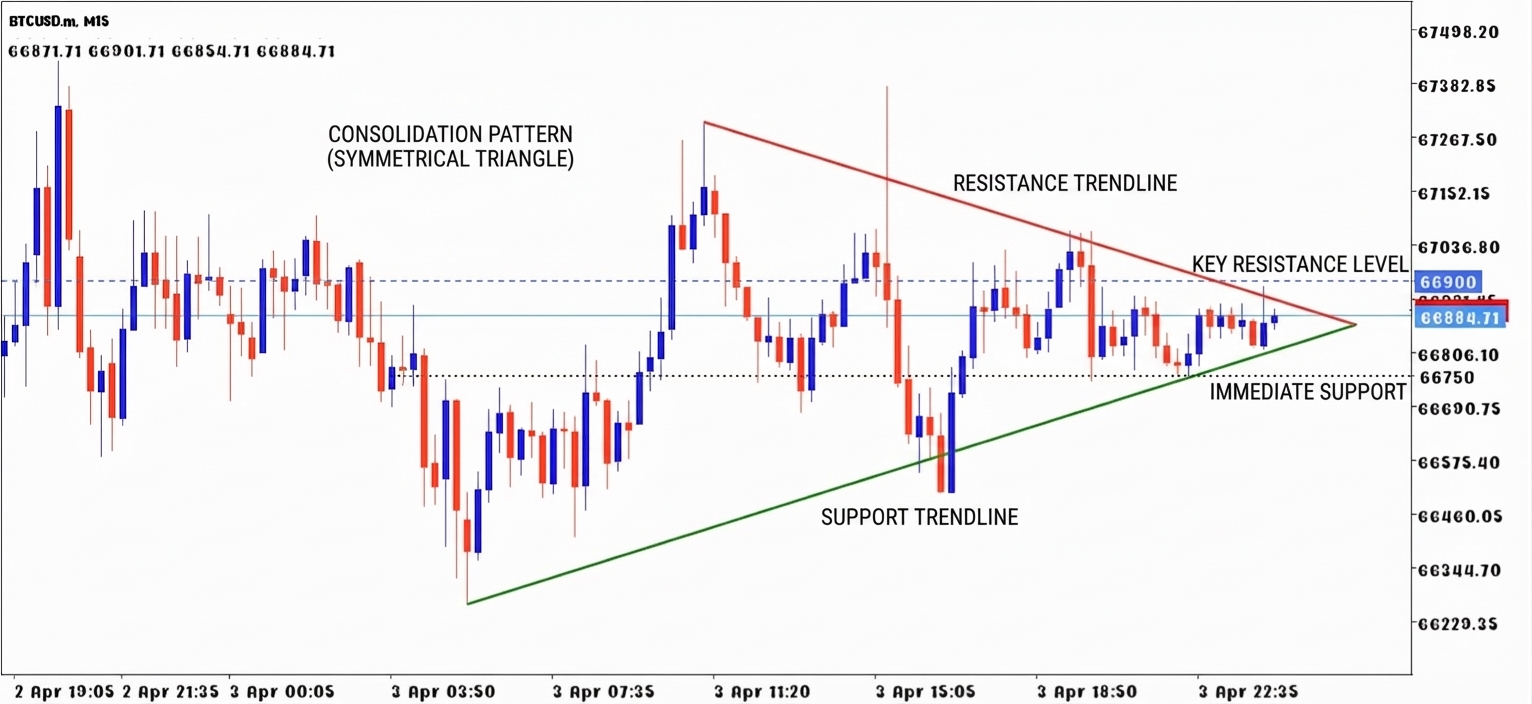
Bitcoin (BTCUSD) is currently consolidating in a tight, sideways range on the 15-minute timeframe, signifying market indecision and making immediate entry risky without a confirmed breakout.
Trend
Following recent volatile swings between roughly 66350 and 67350, the price action has settled into a sideways, range-bound trend with decreasing volatility. There is no clear directional bias in the immediate short term.
Patterns
The chart displays a short-term consolidation pattern, resembling a symmetrical triangle or pennant, characterized by lower highs and higher lows converging towards a central price point.
Indicators
Analysis is based purely on price action. The narrowing trading range indicates a volatility contraction phase, which typically precedes a significant directional move (breakout or breakdown).
Strategy
Adopt a 'wait and see' approach. Do not enter new positions within the current tight range. Await a decisive breakout above the 67100 resistance level to consider a long position, or a clear breakdown below the 66650 support level for a potential short entry.
For reference only, not investment advice. Trading decisions are your own.