



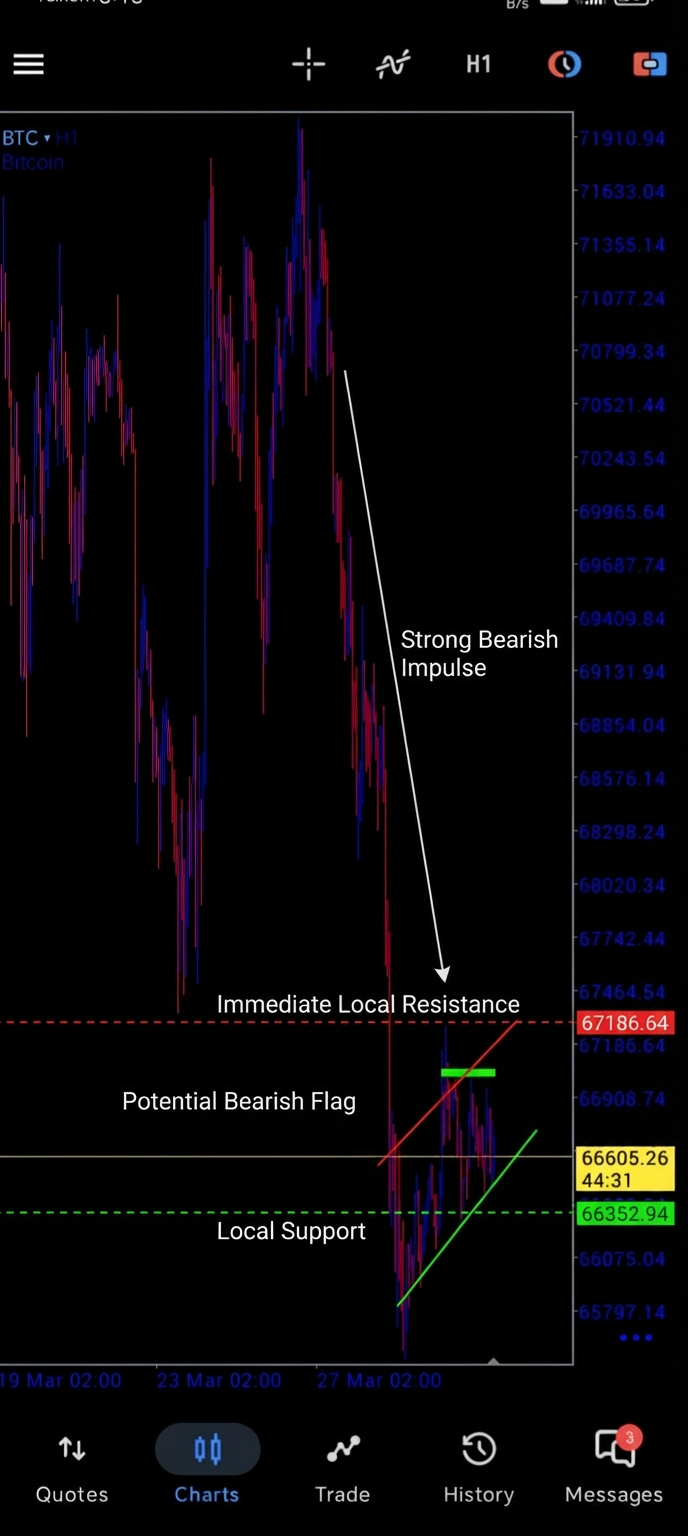
 SellConfidence 75
BTC
12h agoNot tracked
Entry66,605
Target65,500
Stop67,350
Following a sharp bearish drop, the price is consolidating under immediate local resistance, suggesting a higher likelihood of trend continuation downwards.
Browse analyses other traders have shared — and how they played out on real prices.
SellConfidence 75Following a sharp bearish drop, the price is consolidating under immediate local resistance, suggesting a higher likelihood of trend continuation downwards.
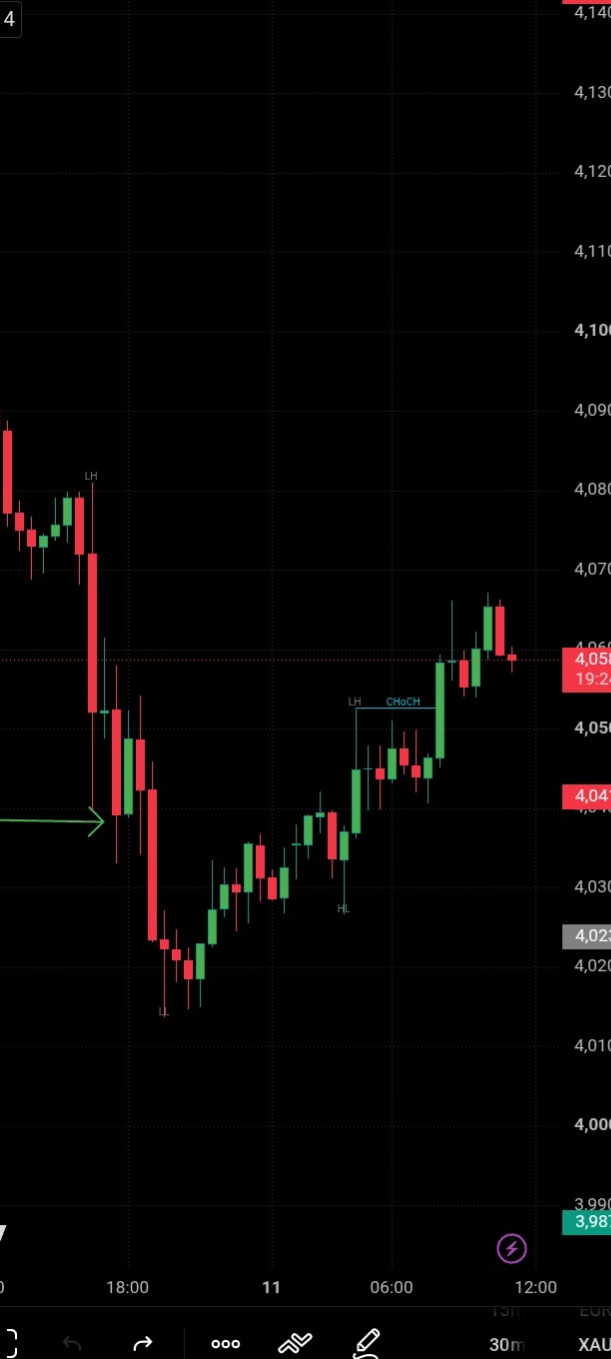 BuyConfidence 75
The asset has undergone a strong V-shaped recovery after printing a local low around 4016, confirming a bullish Change of Character (CHoCH) above 4052. Buying on the current consolidation/pullback presents a favorable risk-to-reward setup targeting the previous supply zone near 4080.
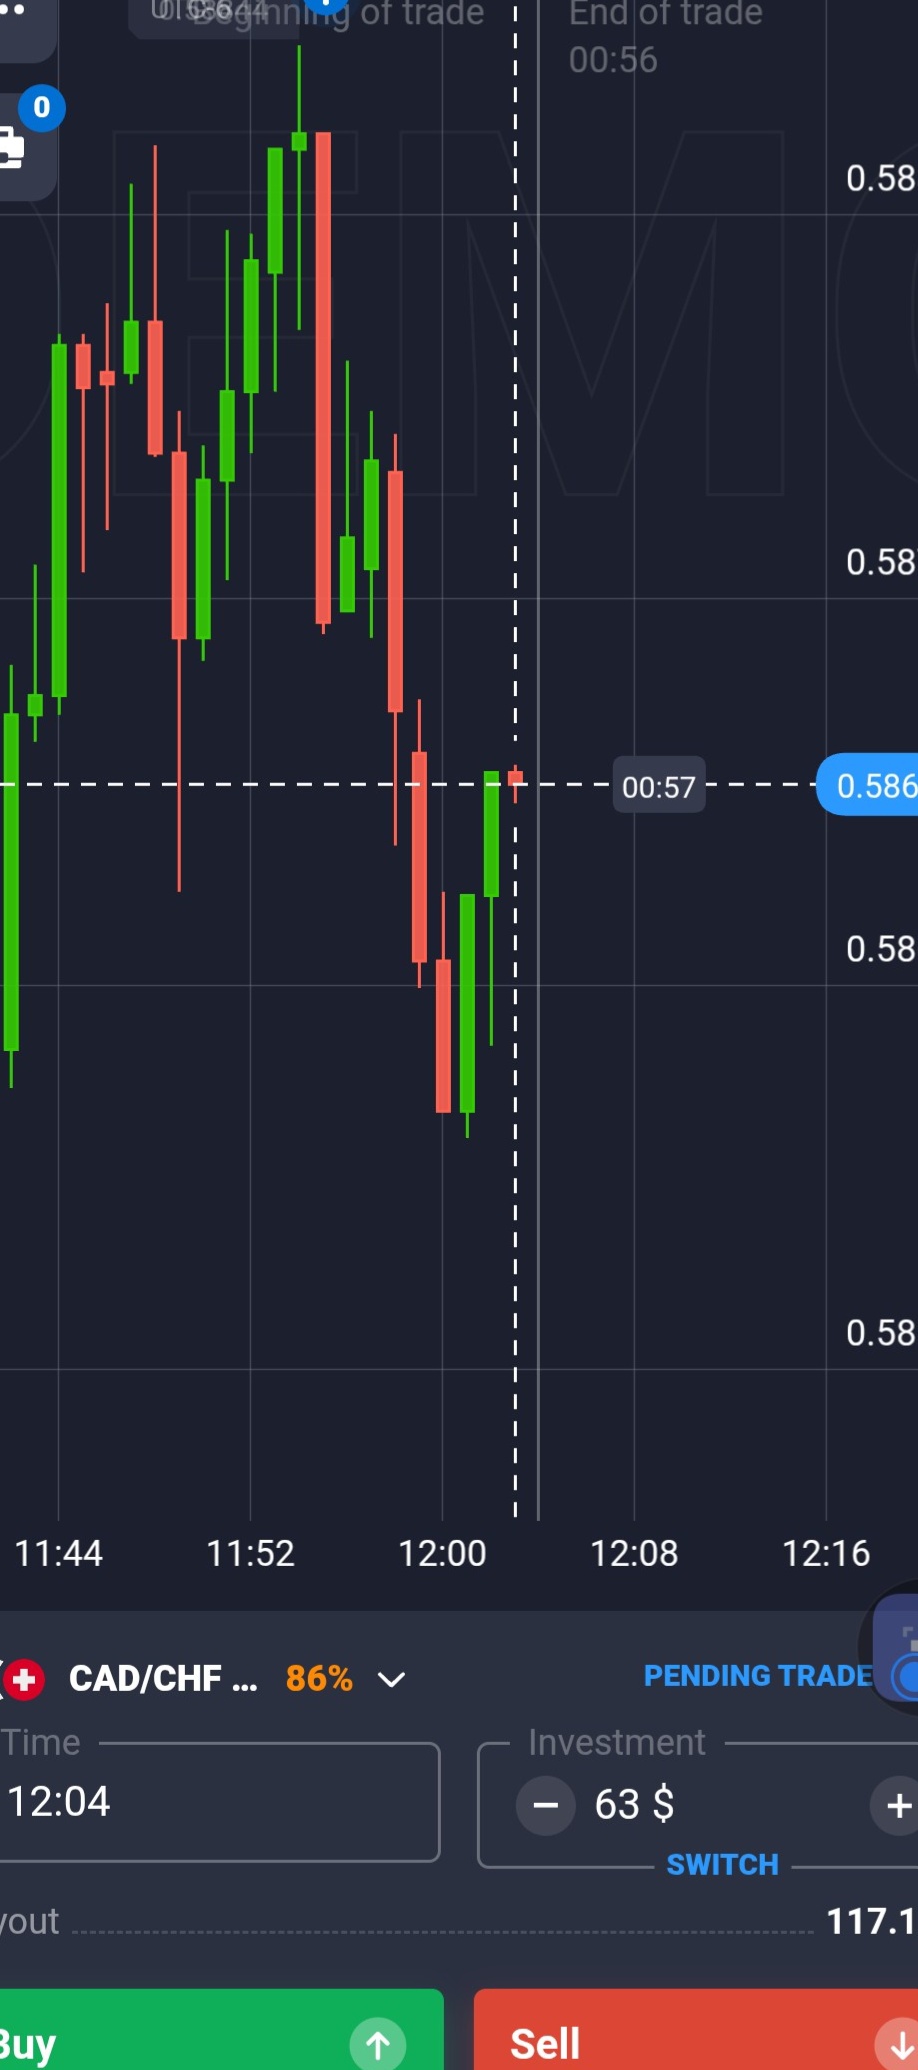 BuyConfidence 70
CAD/CHF shows a sharp V-shaped recovery following a swift drop to key local support near 0.5853, indicating strong buying interest at lower levels.
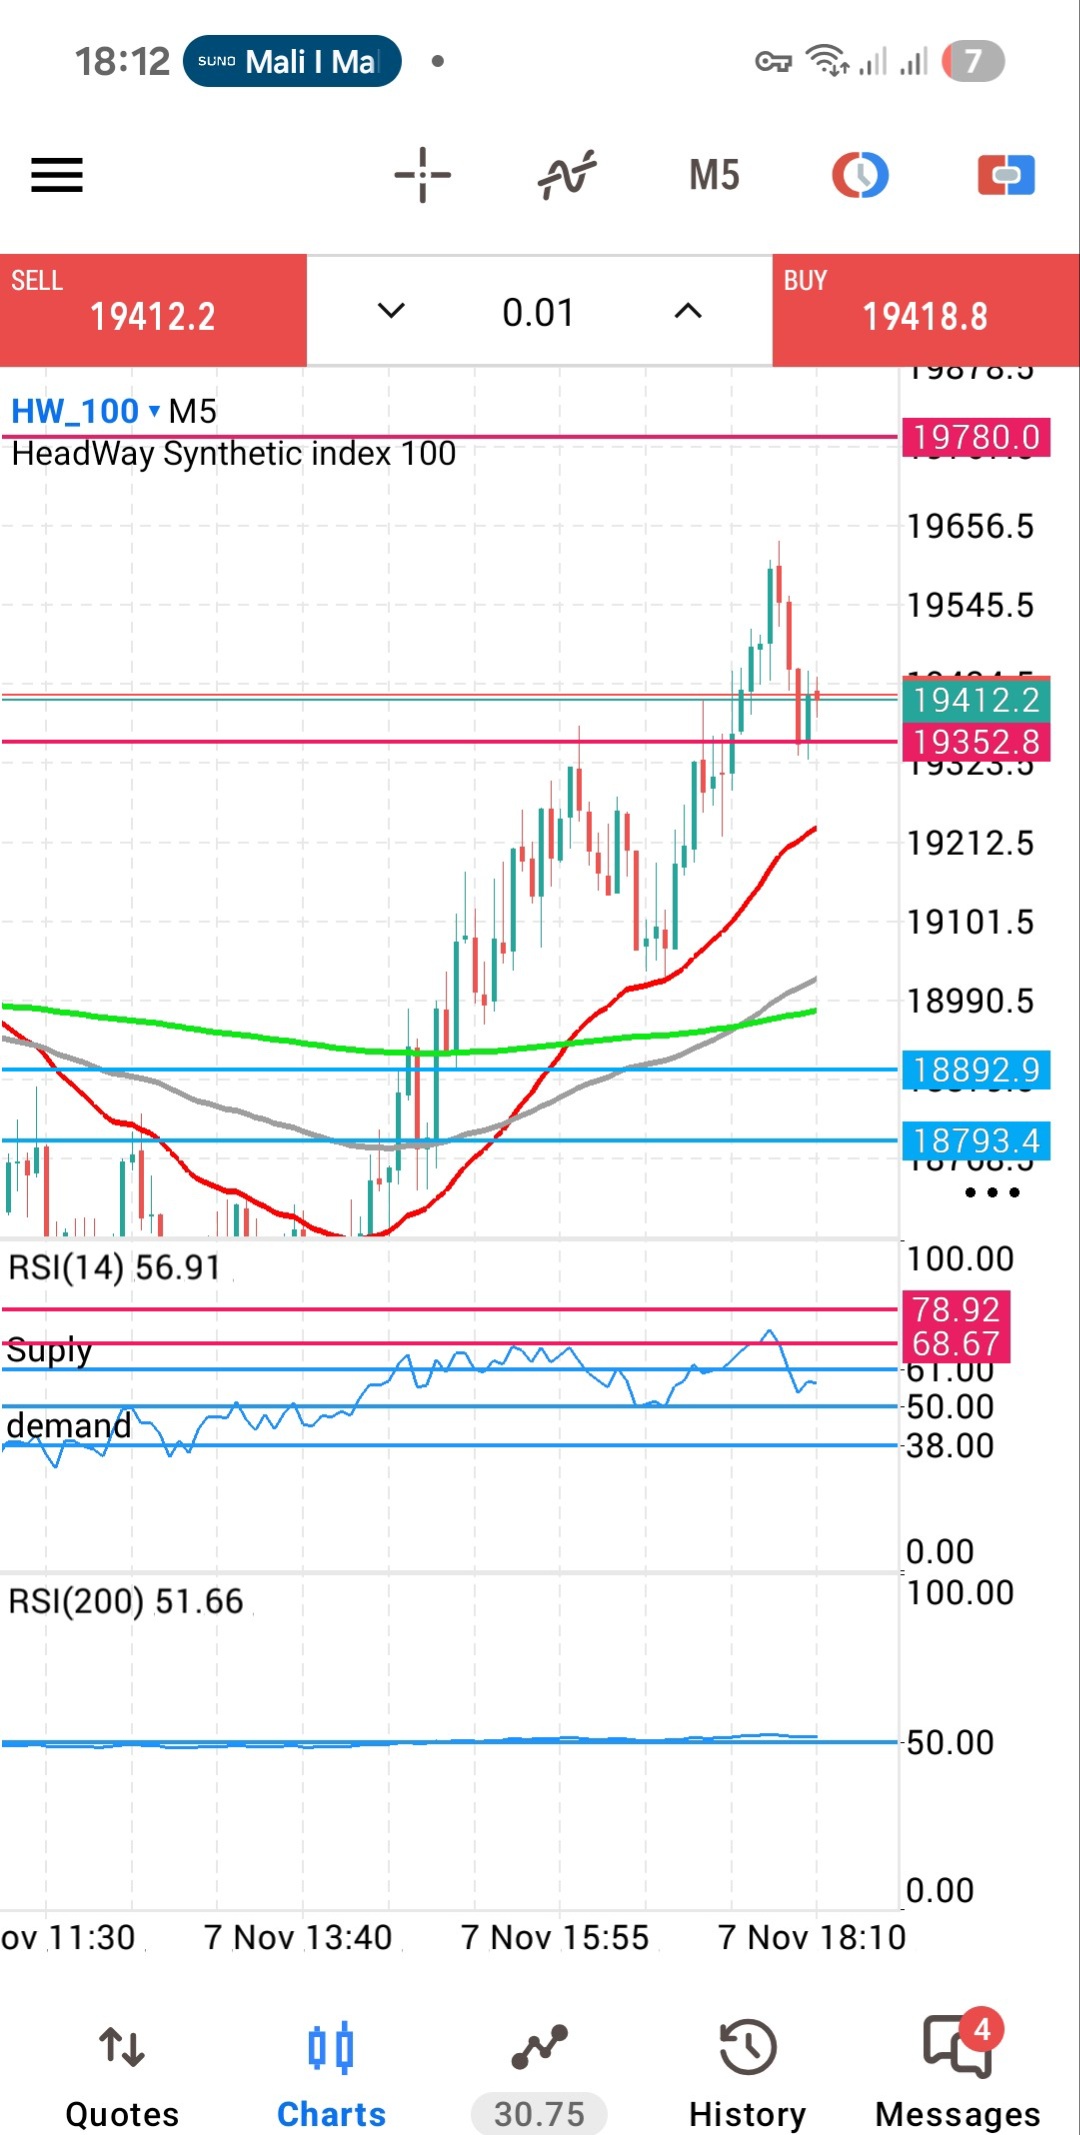 BuyConfidence 75
The asset is experiencing a short-term pullback following a strong bullish breakout from its previous base near 18800 up to a local high of 19600. Buying near the immediate support cluster around 19352.8 offers an attractive risk-to-reward ratio for a retest of the recent peaks.
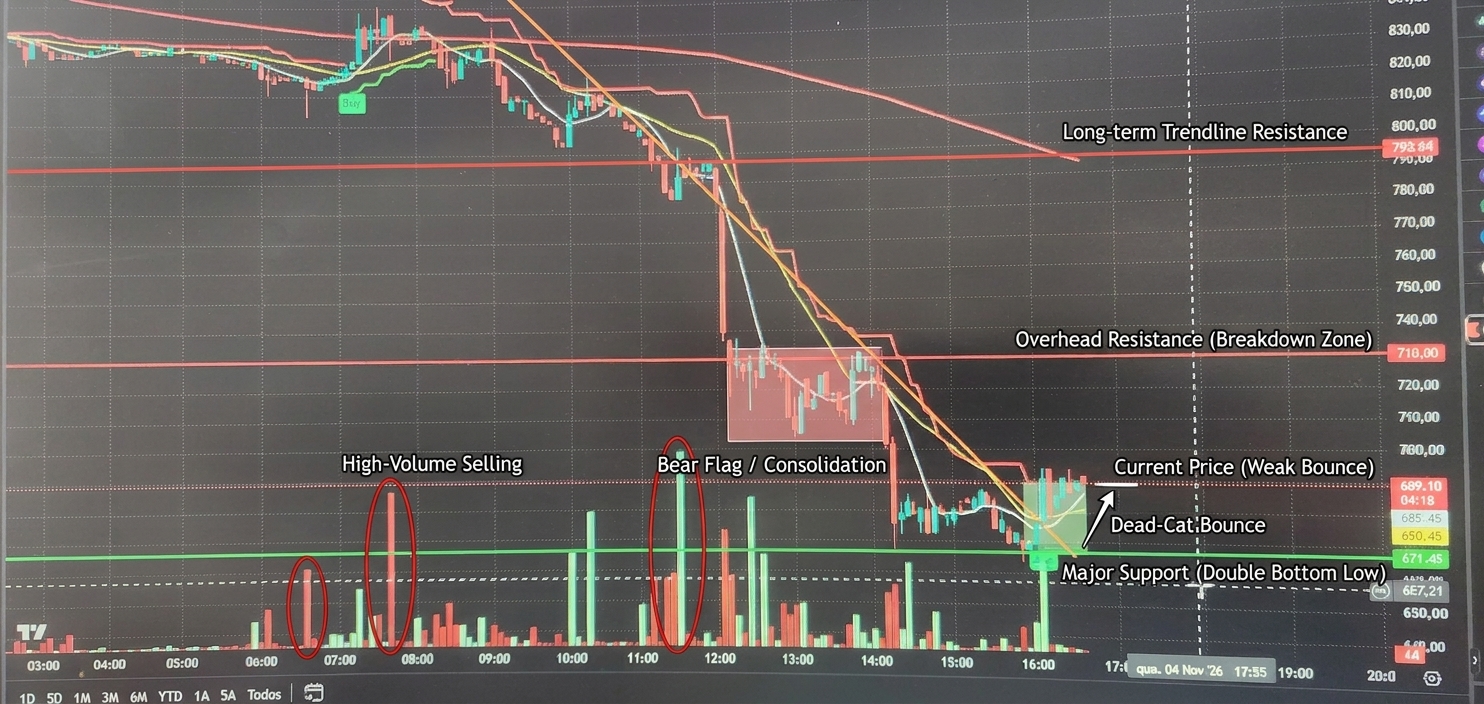 SellConfidence 75
The asset is in a dominant, high-volume downtrend, having fallen sharply from above 830.00 to a low around 671.45. Despite a minor local bounce and short-term buy signal near the bottom, the broader trend remains strongly bearish under heavy overhead resistance.
 BuyConfidence 75
The asset is exhibiting a clear short-term bullish market structure characterized by higher highs and higher lows, supported by an ascending trendline. Buying on a minor dip near the ascending trendline support offers a favorable risk-to-reward setup.
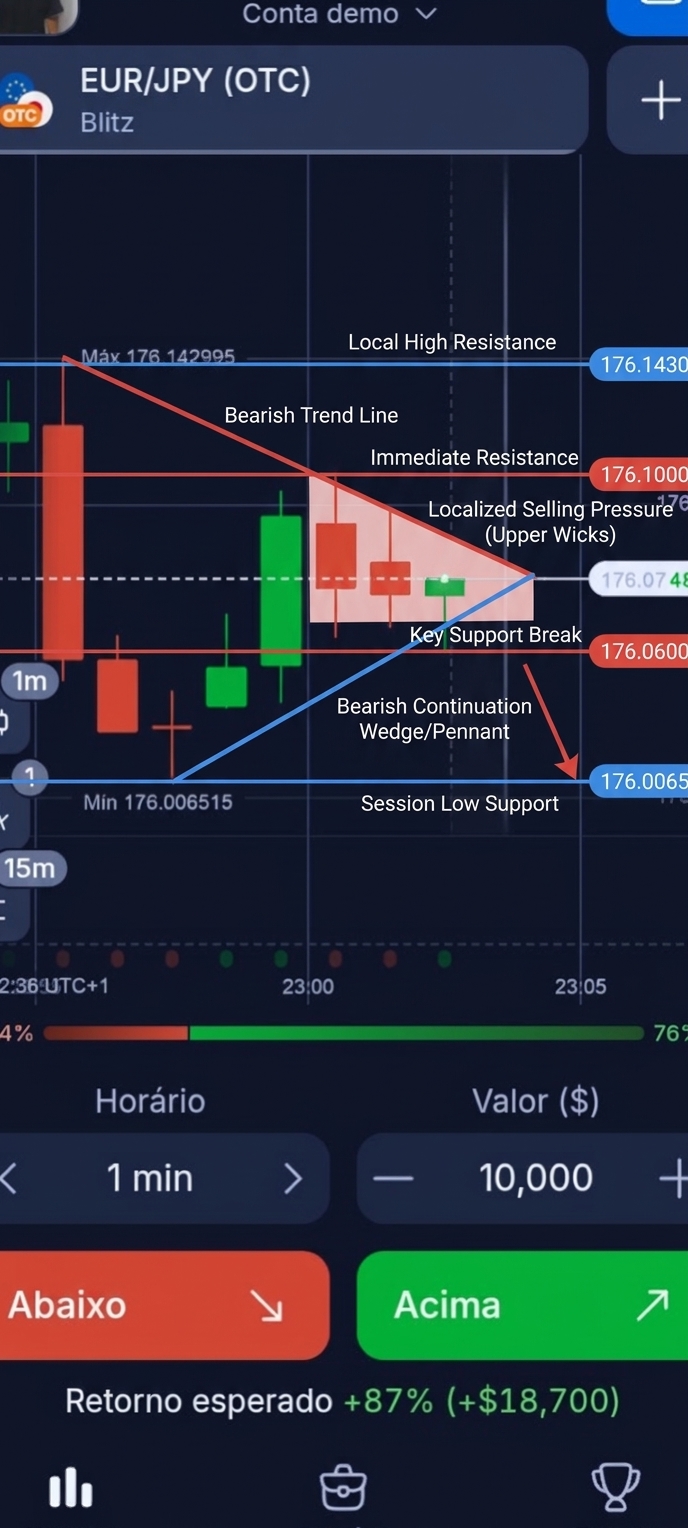 SellConfidence 70
The short-term price action on EUR/JPY (OTC) shows momentum slowing after a bounce from the low of 176.0065, with subsequent candles forming lower highs near resistance. A return to the lower bound of the recent range is expected as sellers regain control.
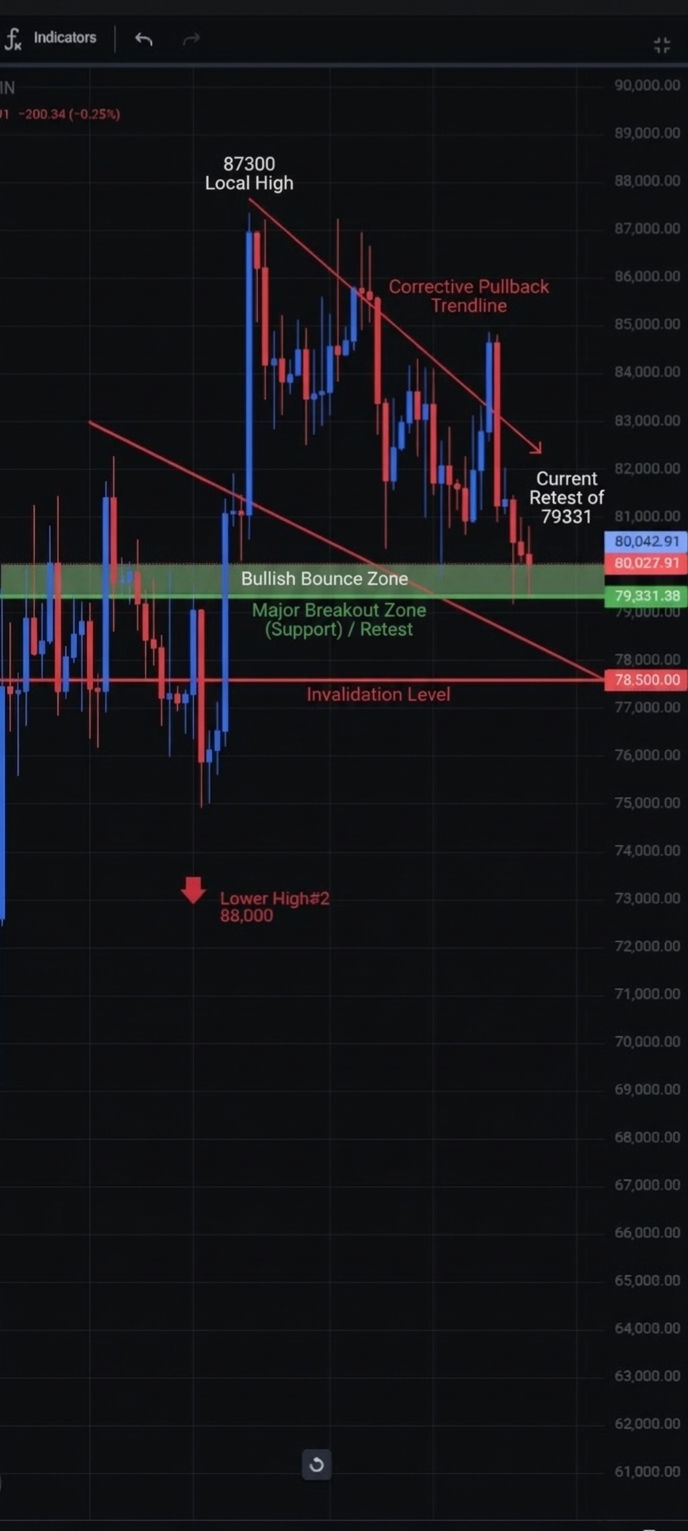 BuyConfidence 75
The asset is currently executing a textbook retest of its major prior breakout zone around 79331 after pulling back from local highs near 87300. Holding above this critical horizontal support provides an attractive risk-to-reward long setup expecting a bullish bounce.
 SellConfidence 75
XAUUSD is in a strong short-term downtrend on the 5-minute chart following a sharp drop from highs above 4153.00 down to 4116.74. Price is currently consolidating near the lows, forming a bearish flag pattern that signals further downside probability.
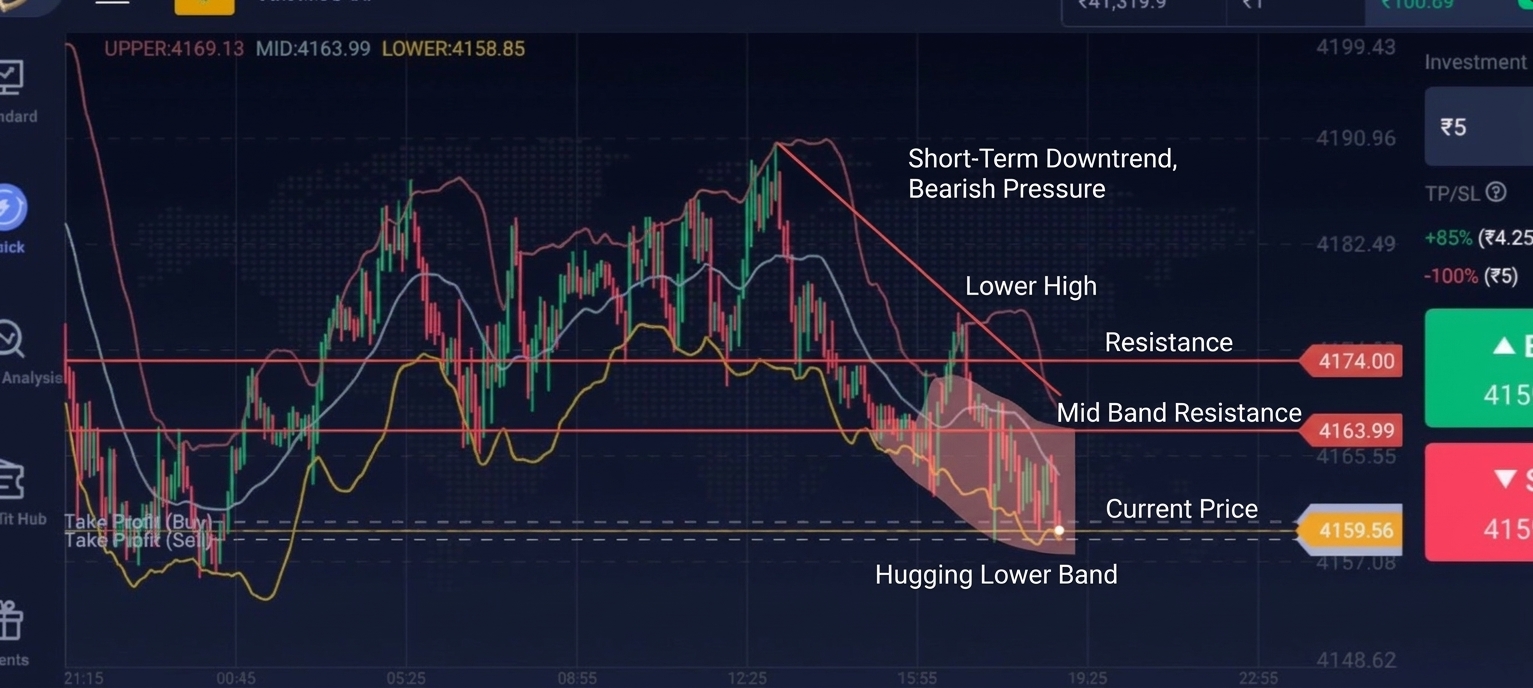 SellConfidence 75
The asset is in a clear short-term downtrend, making lower highs and lower lows from its peak near 4190 down to its current level near 4159. Price action is hugging the lower Bollinger Band, signaling strong bearish continuation pressure.
 SellConfidence 70
Following a rapid uptrend to a sharp peak, the asset experienced a swift bearish rejection and has entered a tight consolidation phase near mid-levels. The failure to retest the recent high combined with long upper wicks indicates selling pressure and favors a continuation down.
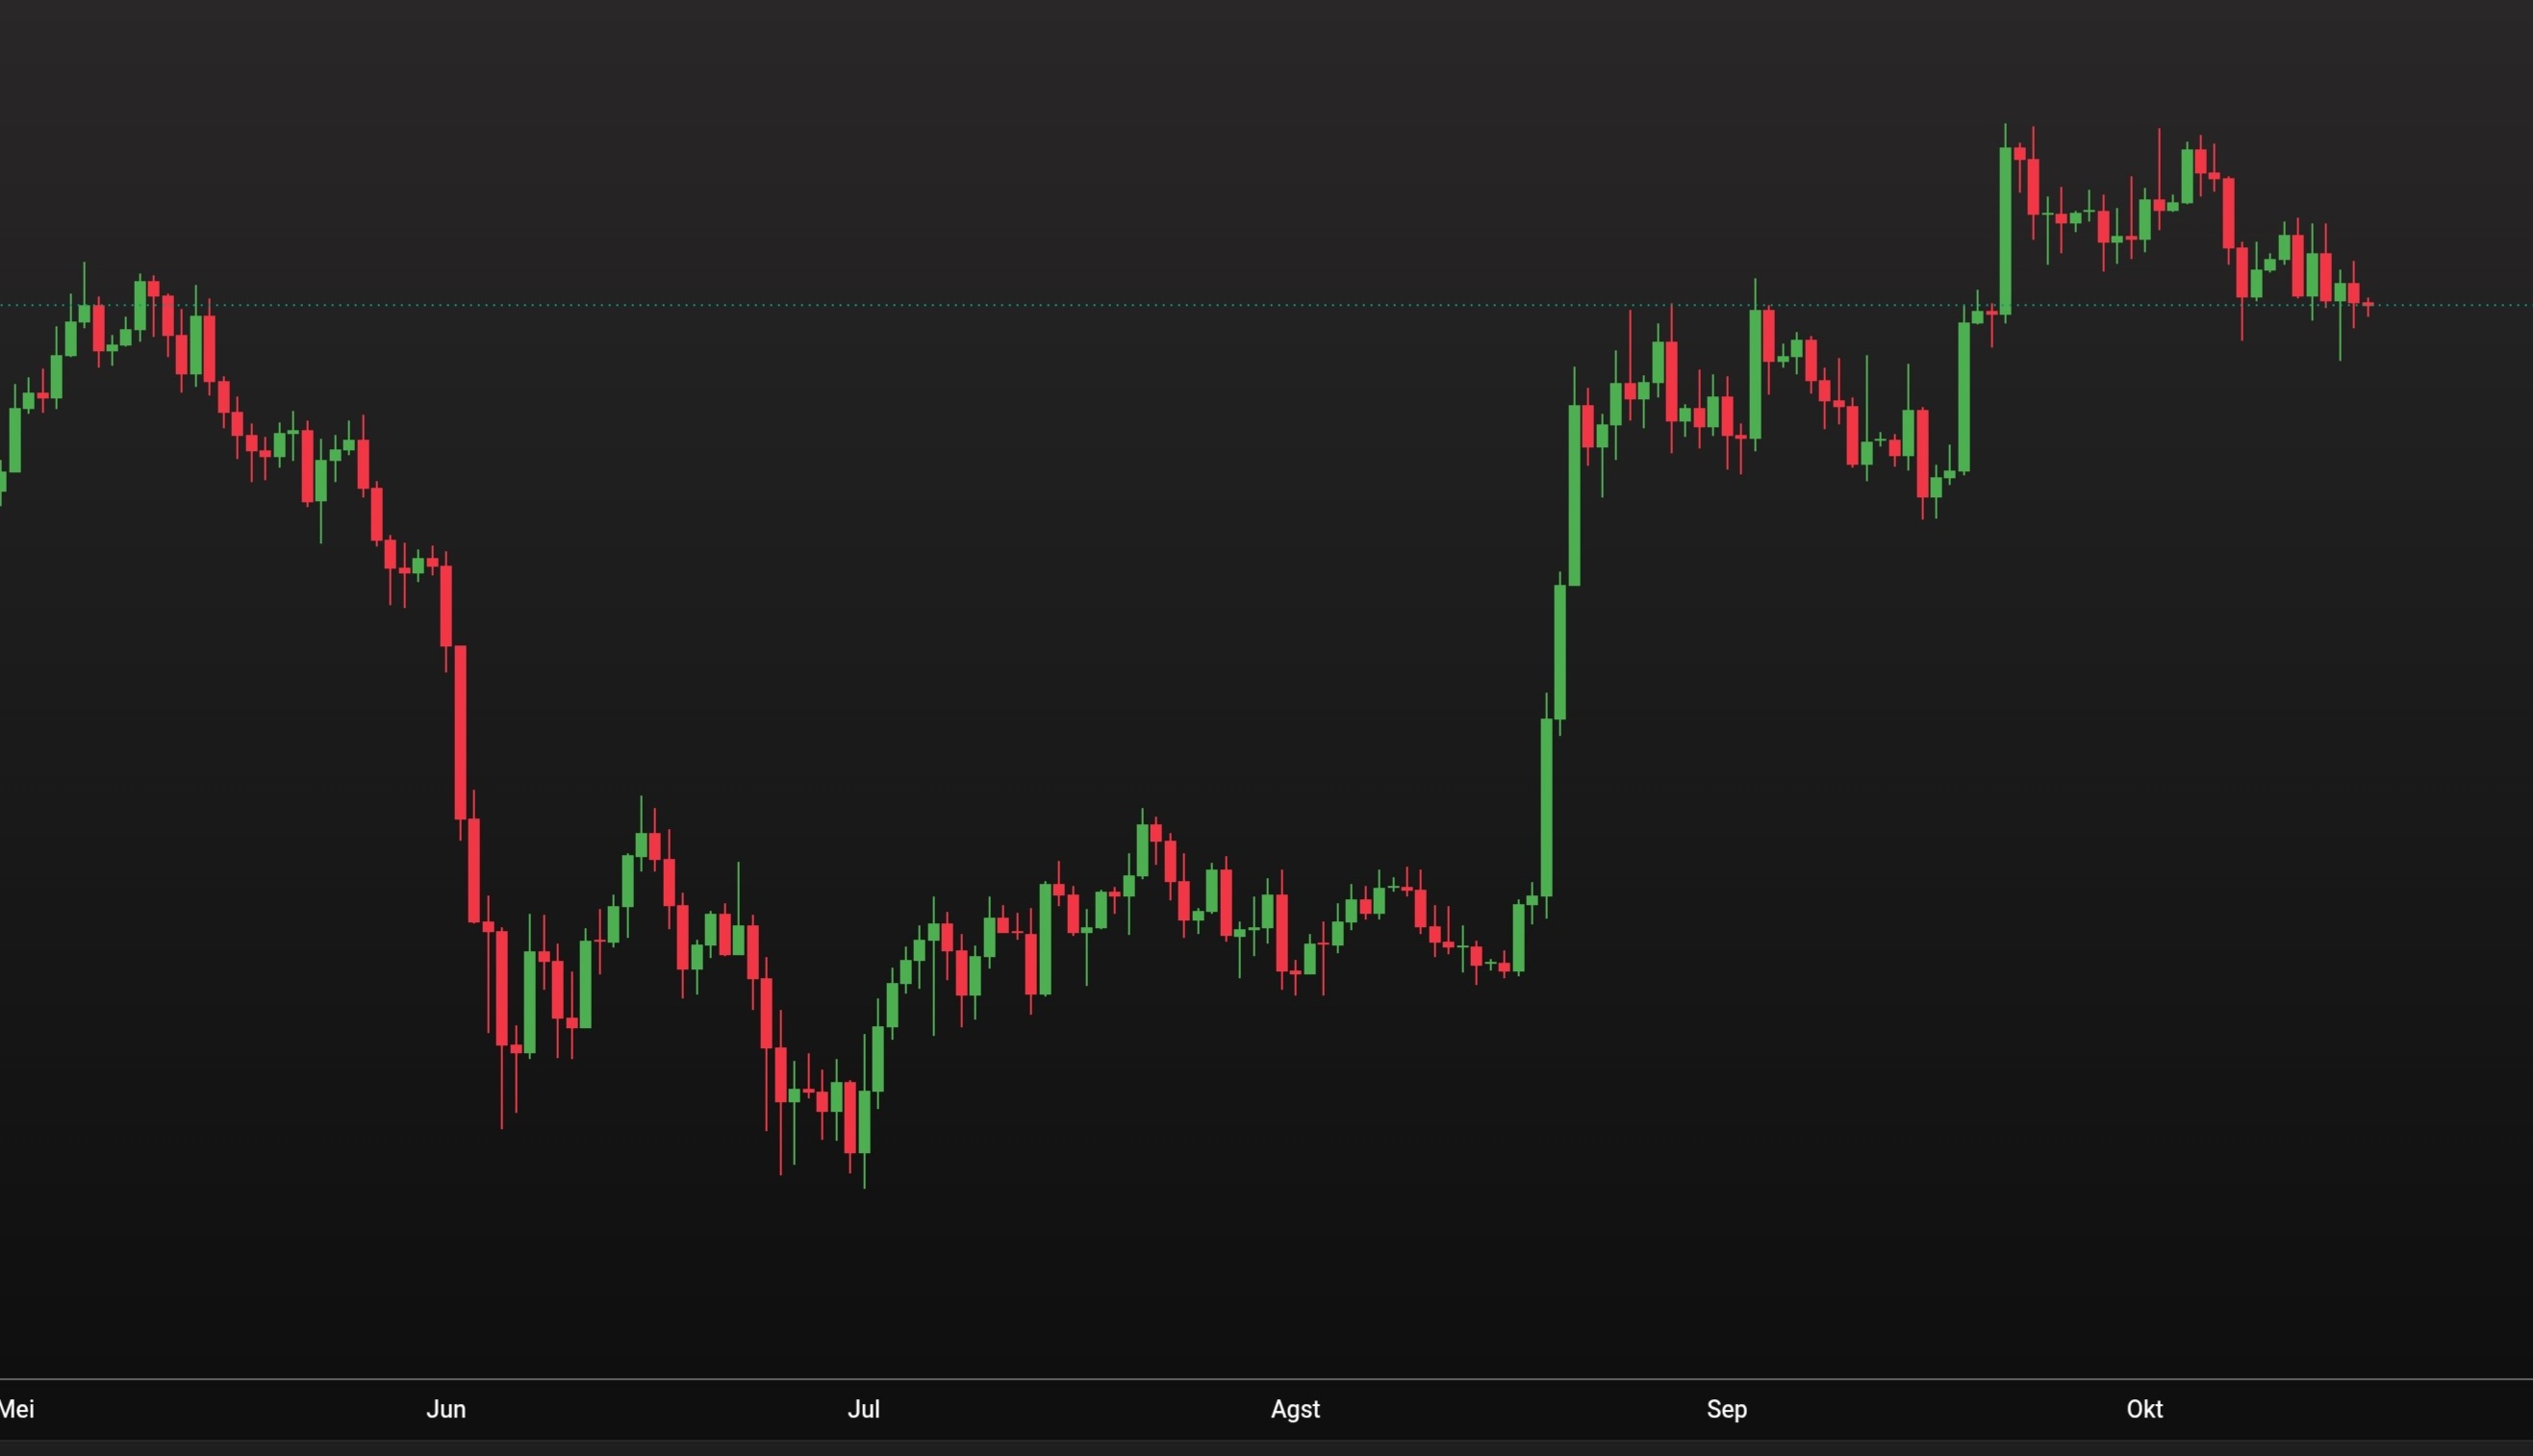 BuyConfidence 75
The asset has completed a successful breakout above a major multi-month horizontal resistance and is currently executing a textbook retest of this key level. Holding above this established support zone presents a favorable risk-reward entry for a bullish continuation move toward recent highs.
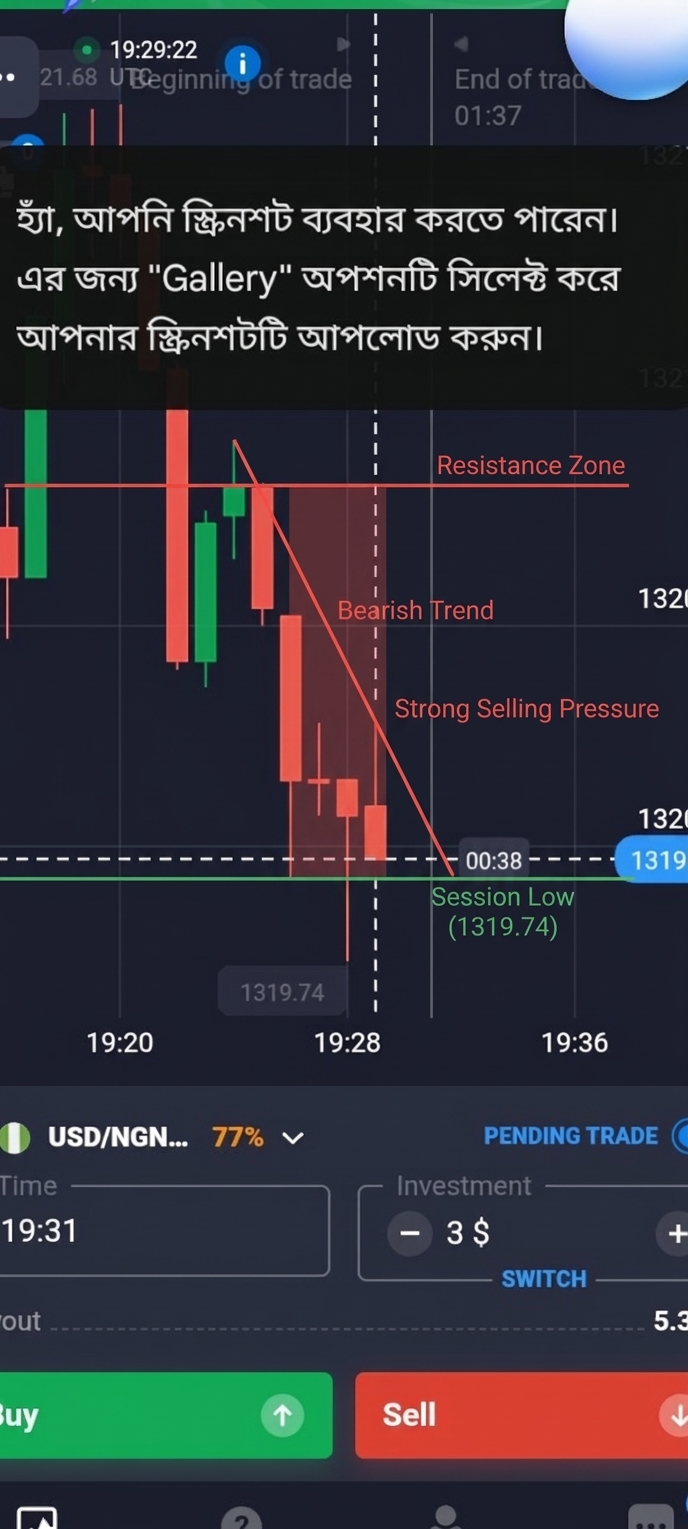 SellConfidence 75
The USD/NGN pair demonstrates decisive short-term bearish momentum after breaking down through psychological support levels. Consecutive large red candles indicate strong selling pressure, making continuation to the downside the most probable outcome.
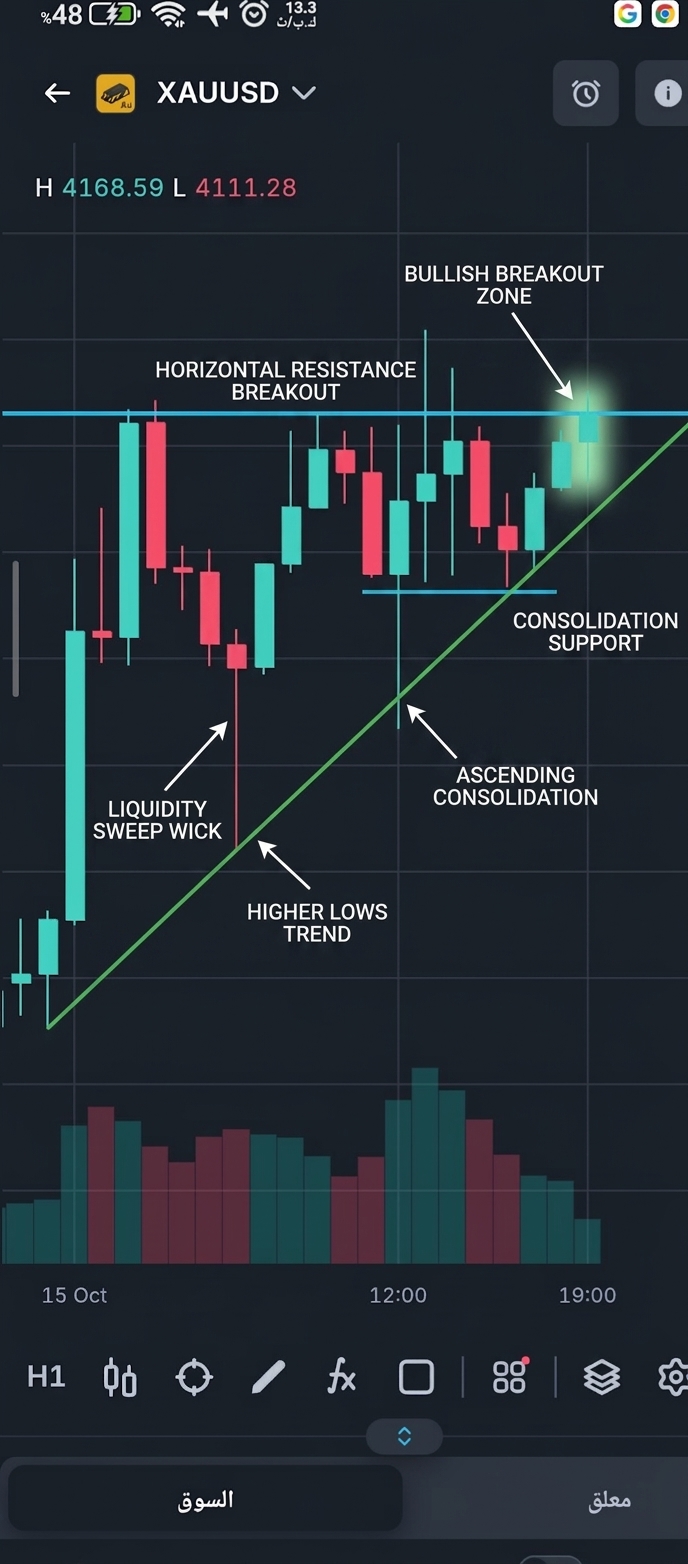 BuyConfidence 75
XAUUSD is attempting a bullish breakout above a key horizontal resistance level following a period of consolidation. The price action demonstrates resilience with higher lows building pressure against the overhead resistance.
 SellConfidence 75
The Volatility 100 (1s) Index shows a sharp rejection near the 1323.00 resistance zone, forming a strong short-term bearish reversal down toward the 1315.00 support level. Bearish momentum has accelerated rapidly with a large red candle breaching below 1320.00.
 BuyConfidence 75
GBP/NZD has staged a sharp recovery from the local low of 1.86983 reached around 23:20 and is currently consolidating above the mid-band of its volatility envelope near 1.87541.
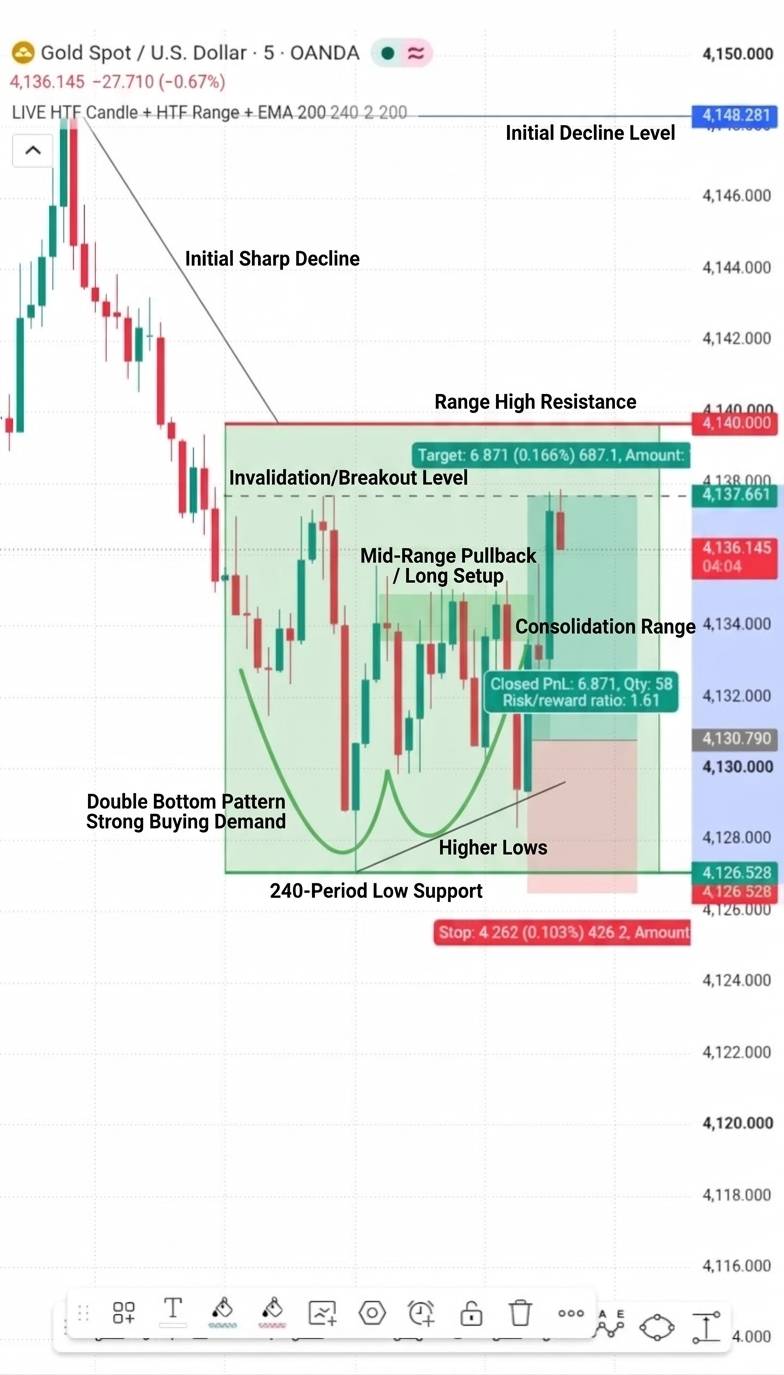 BuyConfidence 75
Gold is consolidating in a well-defined intraday range on the 5-minute timeframe after an initial sharp decline from above 4148. The price has successfully bounced off the 240-period low near 4126.50, demonstrating strong buying demand at lower levels and setting up a retest of the range high at 4140.00.
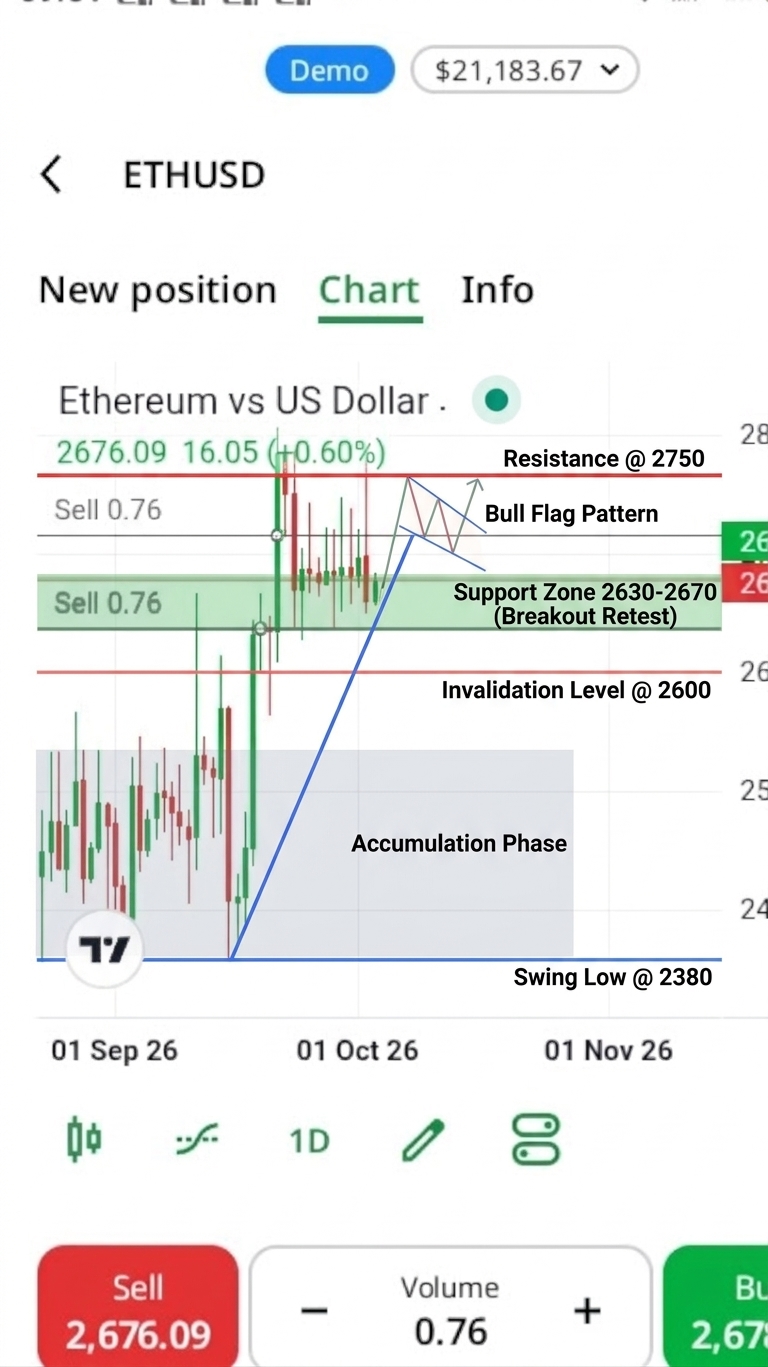 BuyConfidence 70
ETHUSD has staged a powerful recovery from its late-September lows around 2400, breaking out to a peak above 2750. The current price action around 2676 represents a healthy high-level consolidation, offering an attractive risk-reward entry for a continuation move upward.
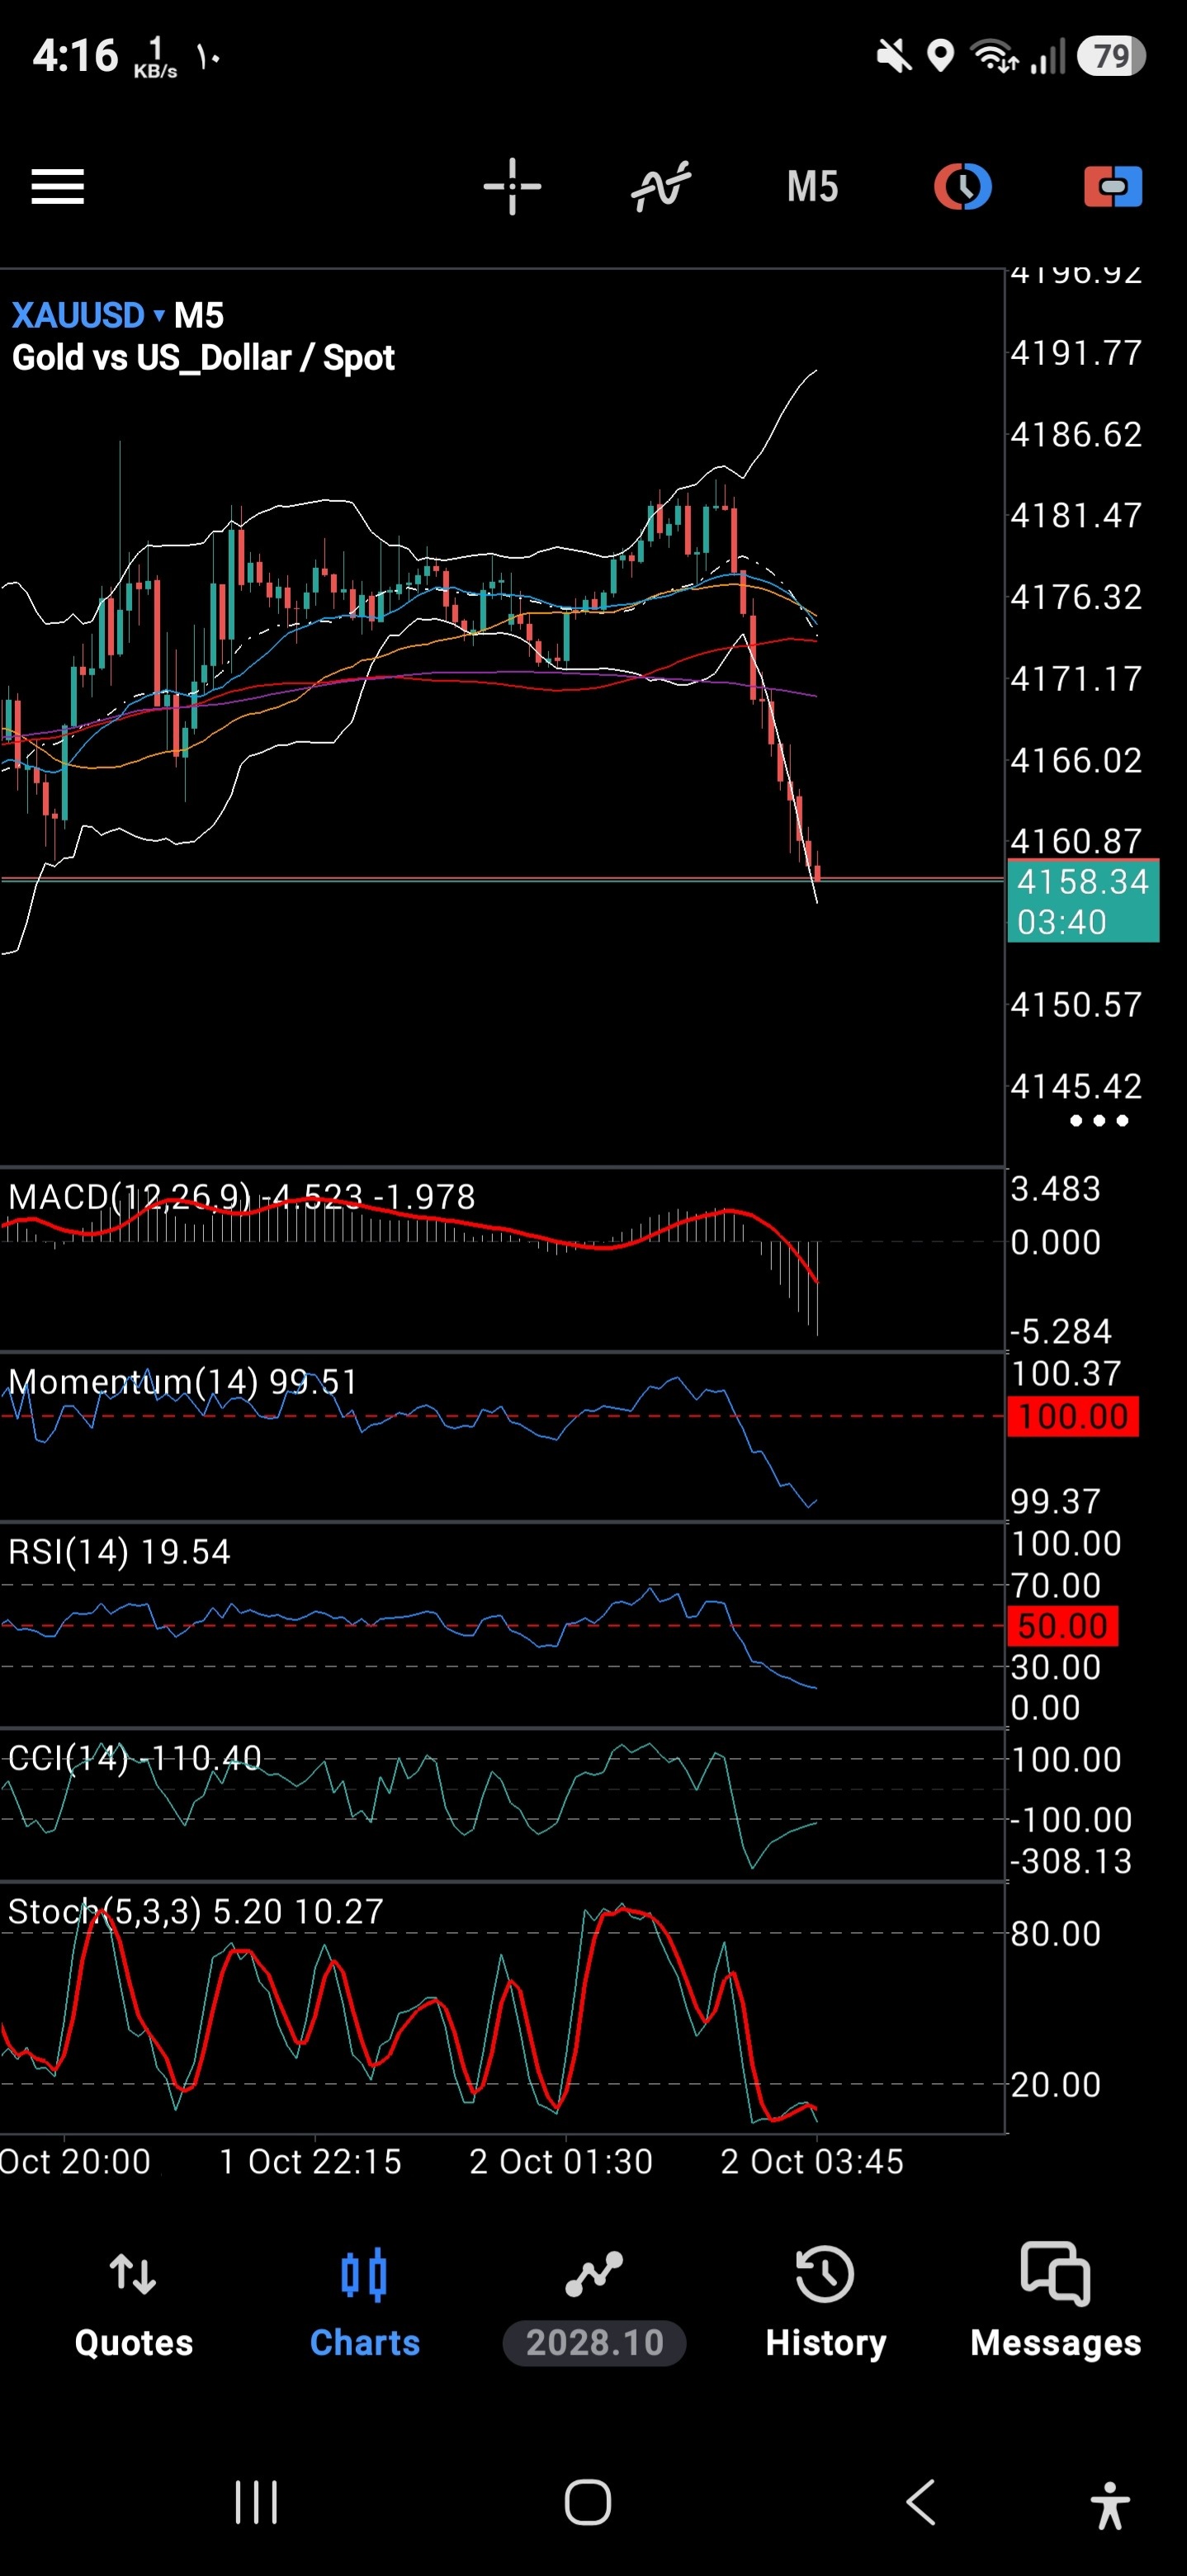 SellConfidence 85
Gold (XAUUSD) on the M5 chart exhibits a severe short-term breakdown below key moving averages and the lower Bollinger Band. Strong downside momentum across all oscillators signals persistent selling pressure.
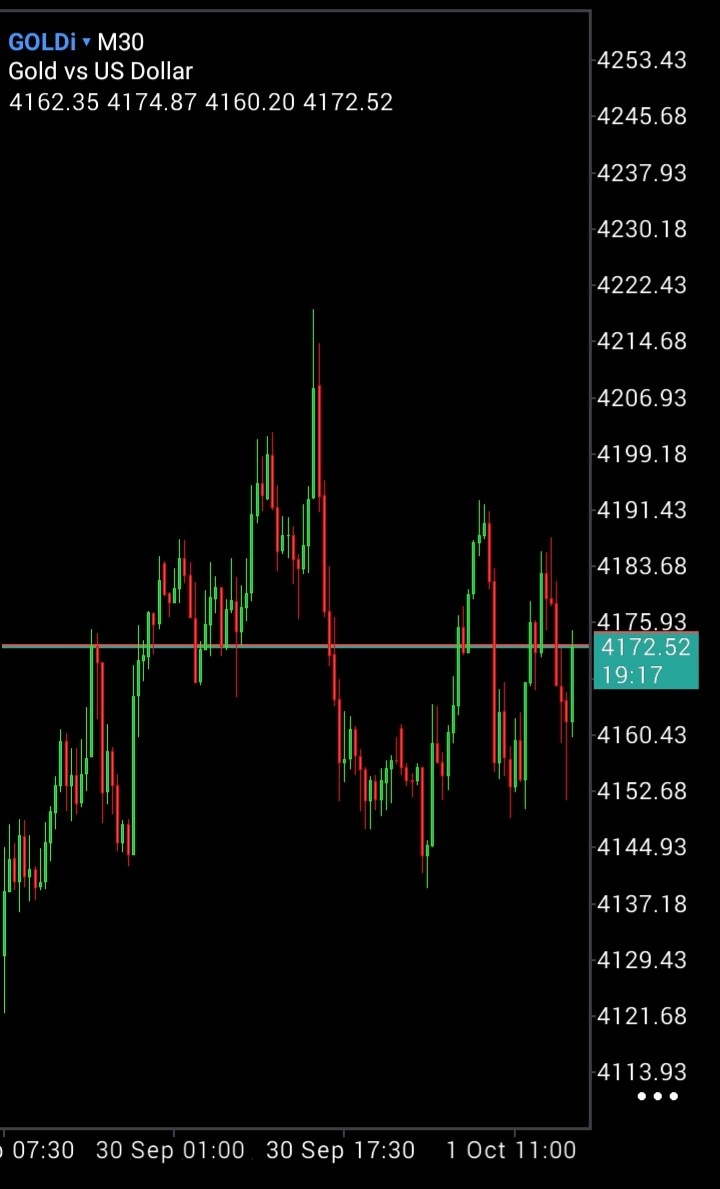 SellConfidence 75
Gold (GOLDi) on the 30-minute timeframe has printed a clear lower high at 4193 following a steep drop from the 4222 peak, signaling a shift to bearish momentum. Selling near the current price of 4172.52 targets the recent support low near 4145.
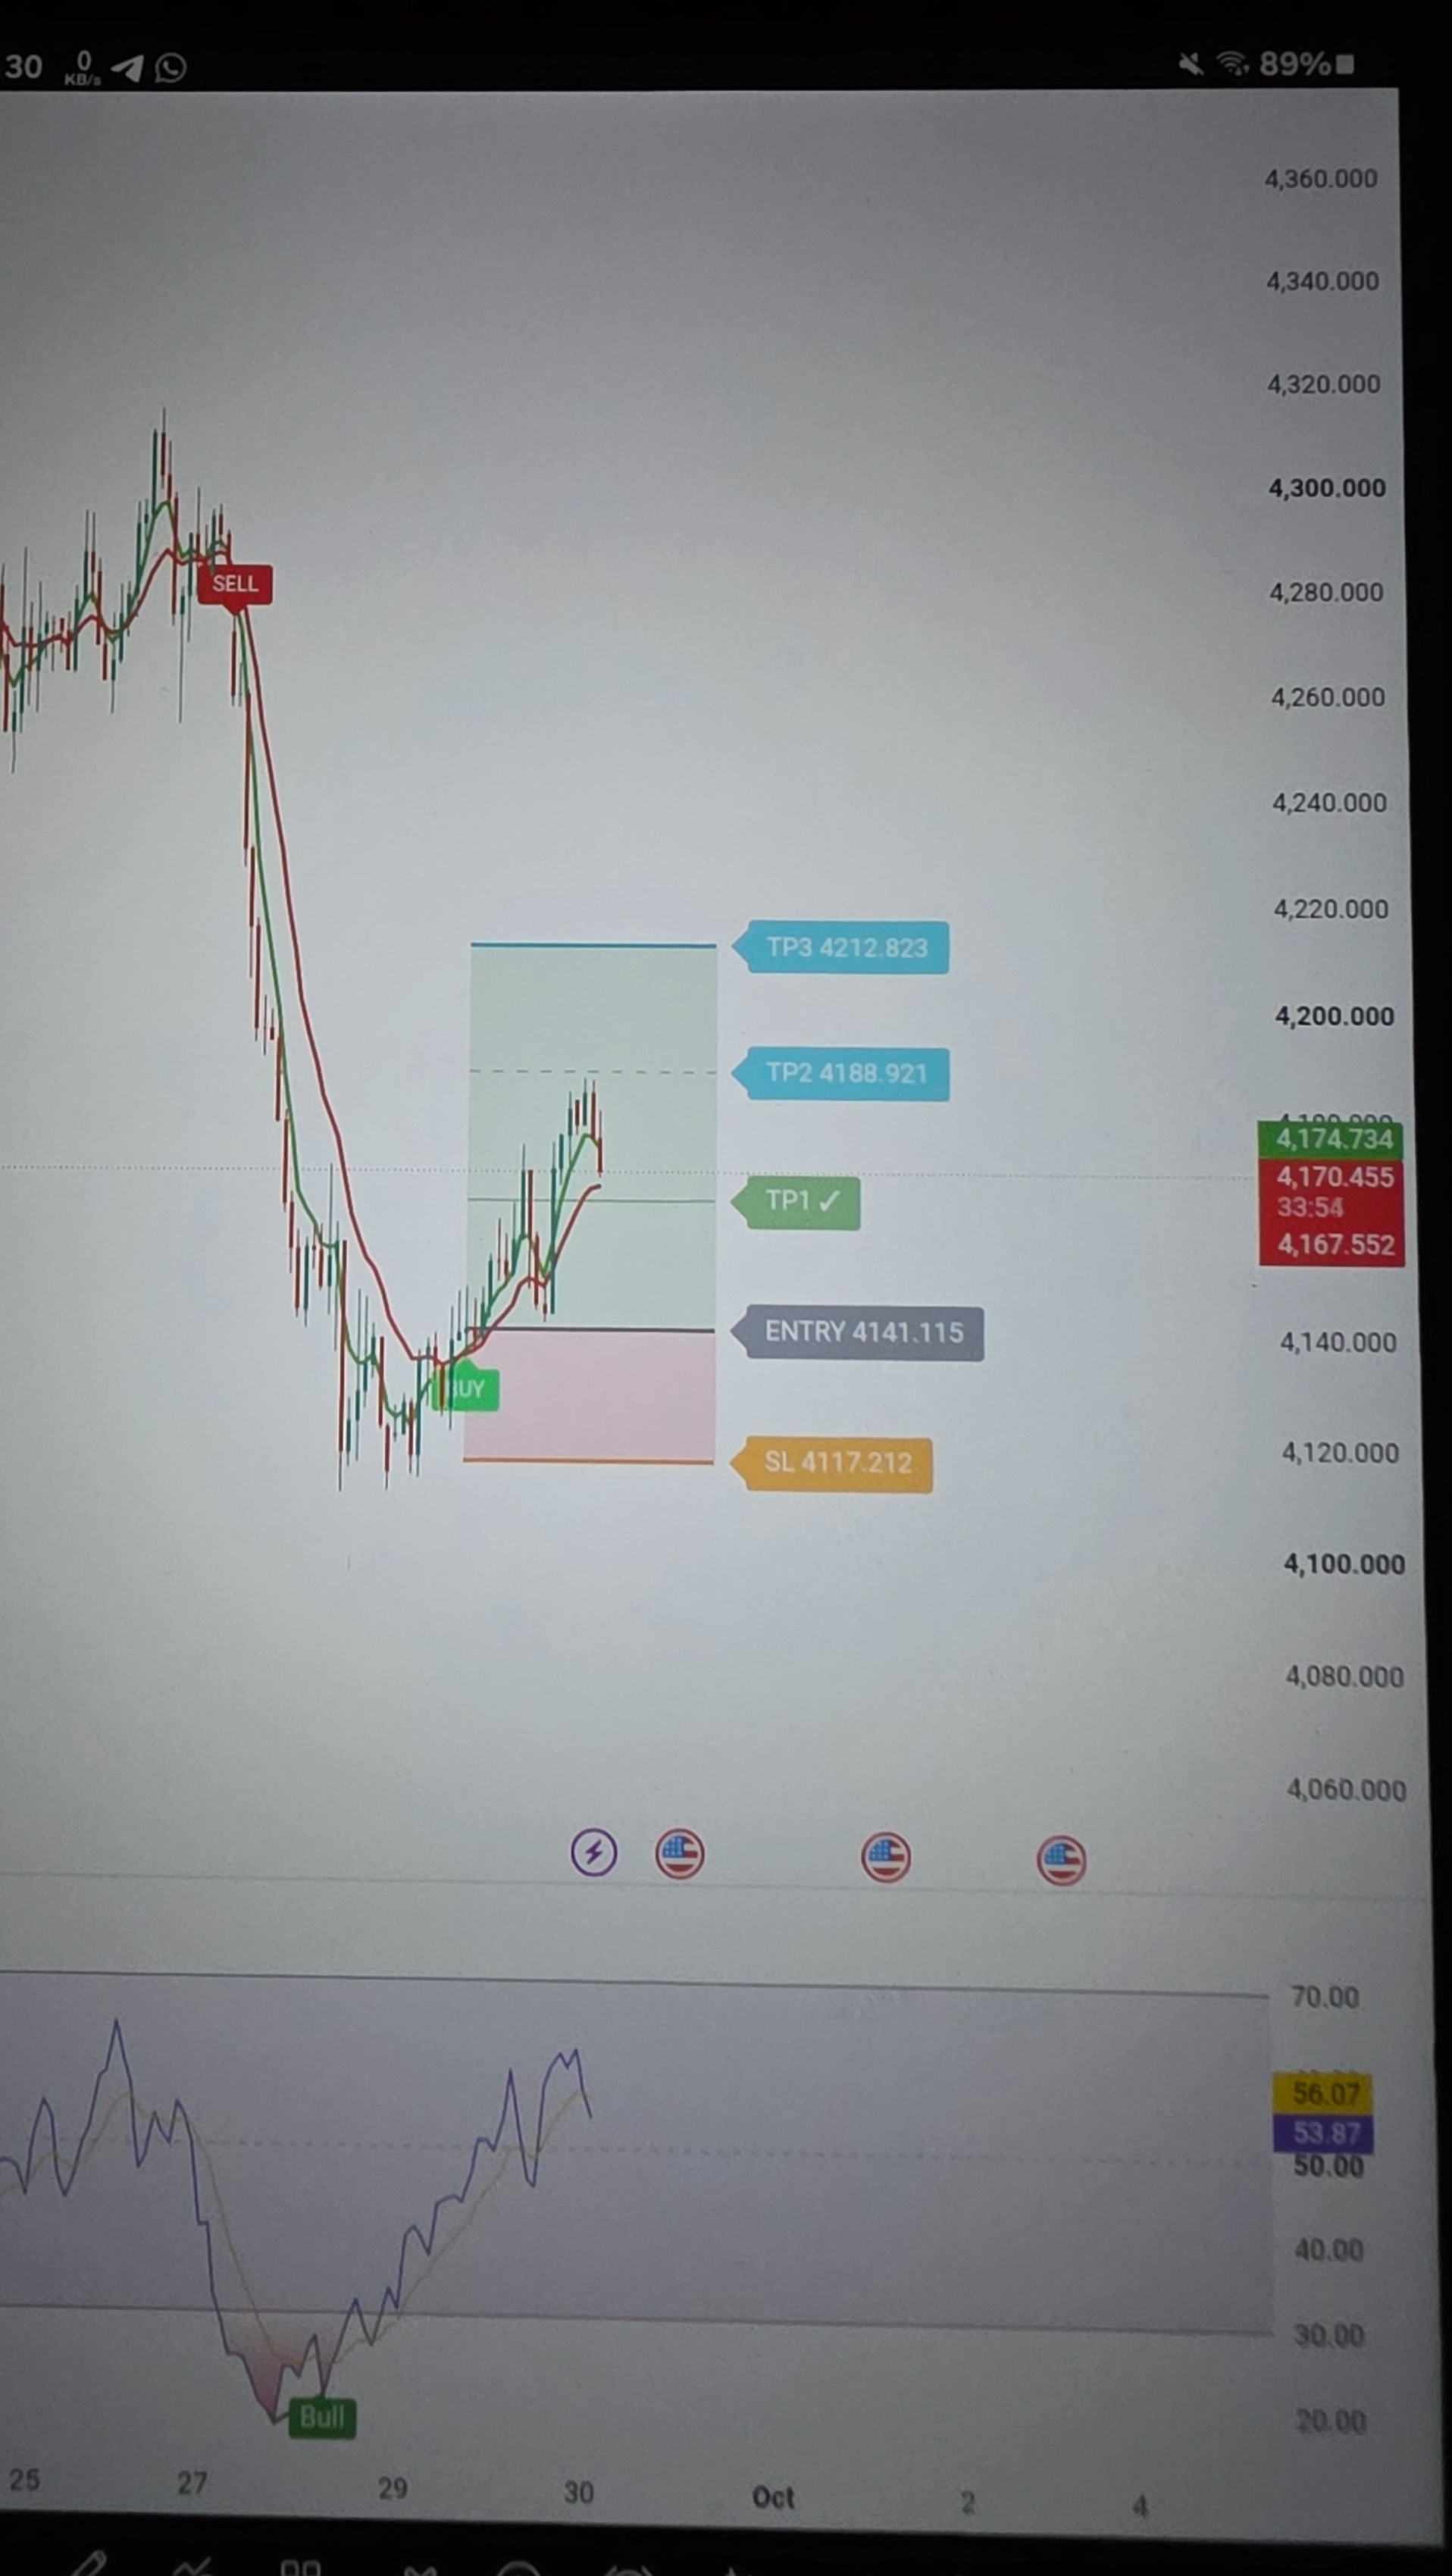 BuyConfidence 75
The asset has completed a strong rounded bottom recovery following a sharp drop from above 4300, triggering an automated BUY signal near 4141.115. Price action has successfully hit TP1 and is currently consolidating above initial entry levels with bullish moving average alignment.
 BuyConfidence 70
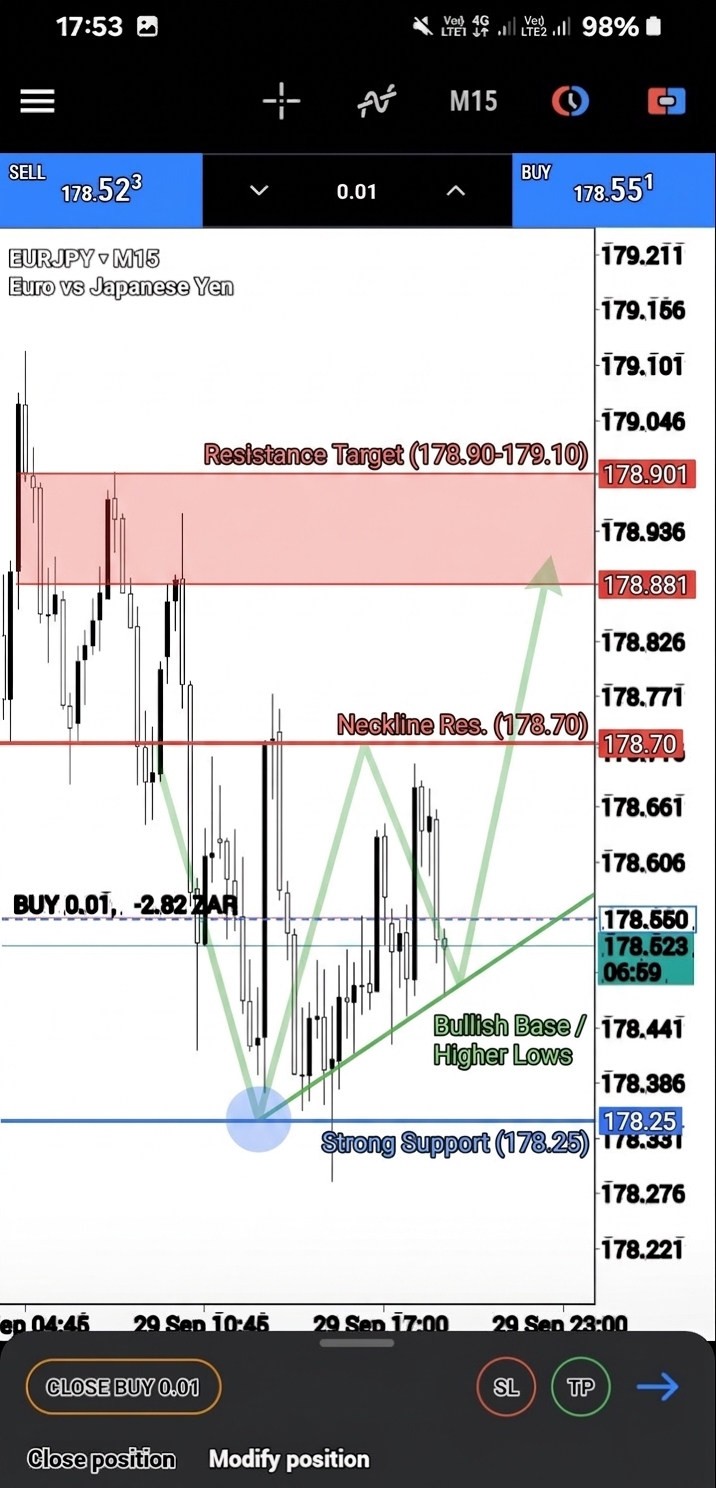
EURJPY shows signs of price stabilization on the 15-minute timeframe, forming a local higher low after bouncing off strong support near 178.25. A continuation toward recent local swing highs around 178.90 to 179.10 is expected if current support holds.
 BuyConfidence 75
XRP/USD on the 5-minute timeframe has established a bullish trend reversal from its local bottom, breaking above key intermediate resistance. The current pull-back to horizontal support (cyan line) provides a high-probability long entry setup expecting a retest of the upper resistance zone.
 SellConfidence 75
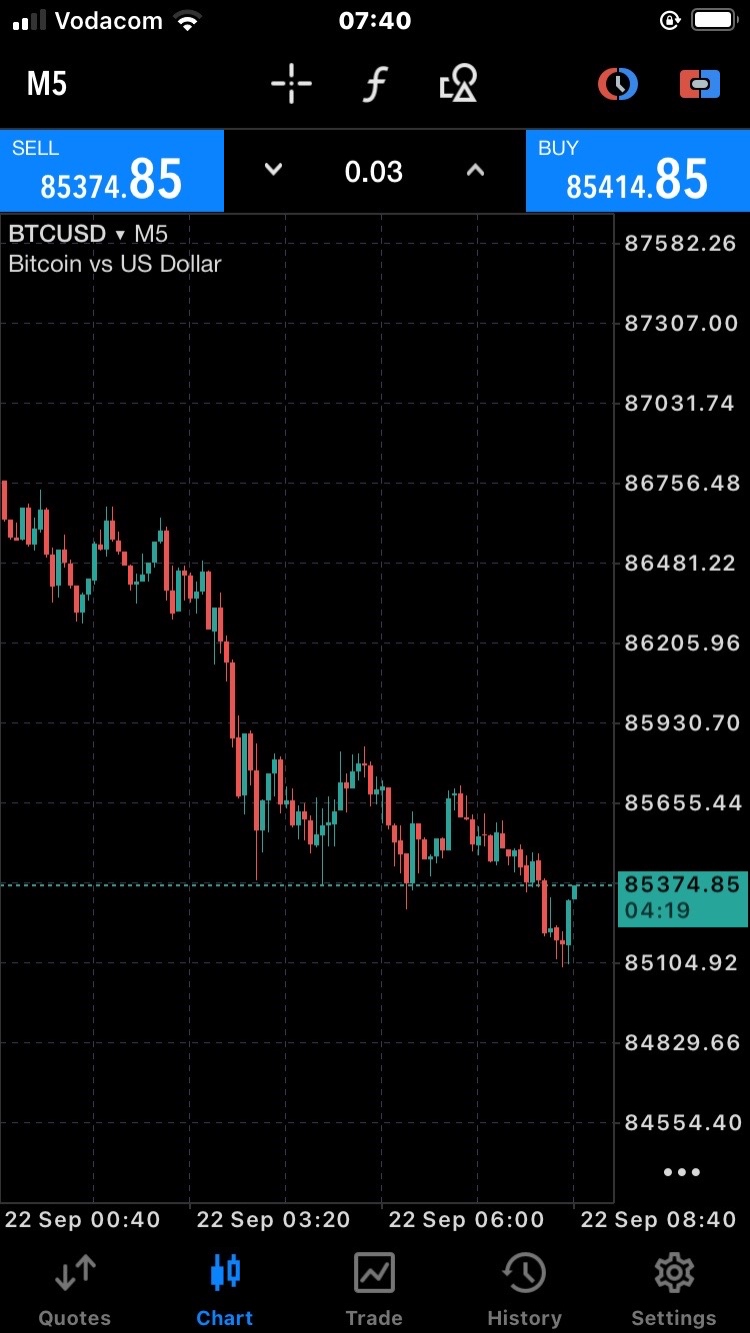
The 5-minute BTCUSD chart displays a dominant short-term downtrend characterized by strong bearish momentum and consecutive lower lows. A brief pull-back is currently attempting to form, presenting a tactical shorting opportunity on a rejection near immediate resistance.