AAPL Buy analysis
- Confidence
- 75
- Entry
- 260.48
- Target
- 275.00
- Stop
- 249.00
- Published
- 2026-05-06
Summary
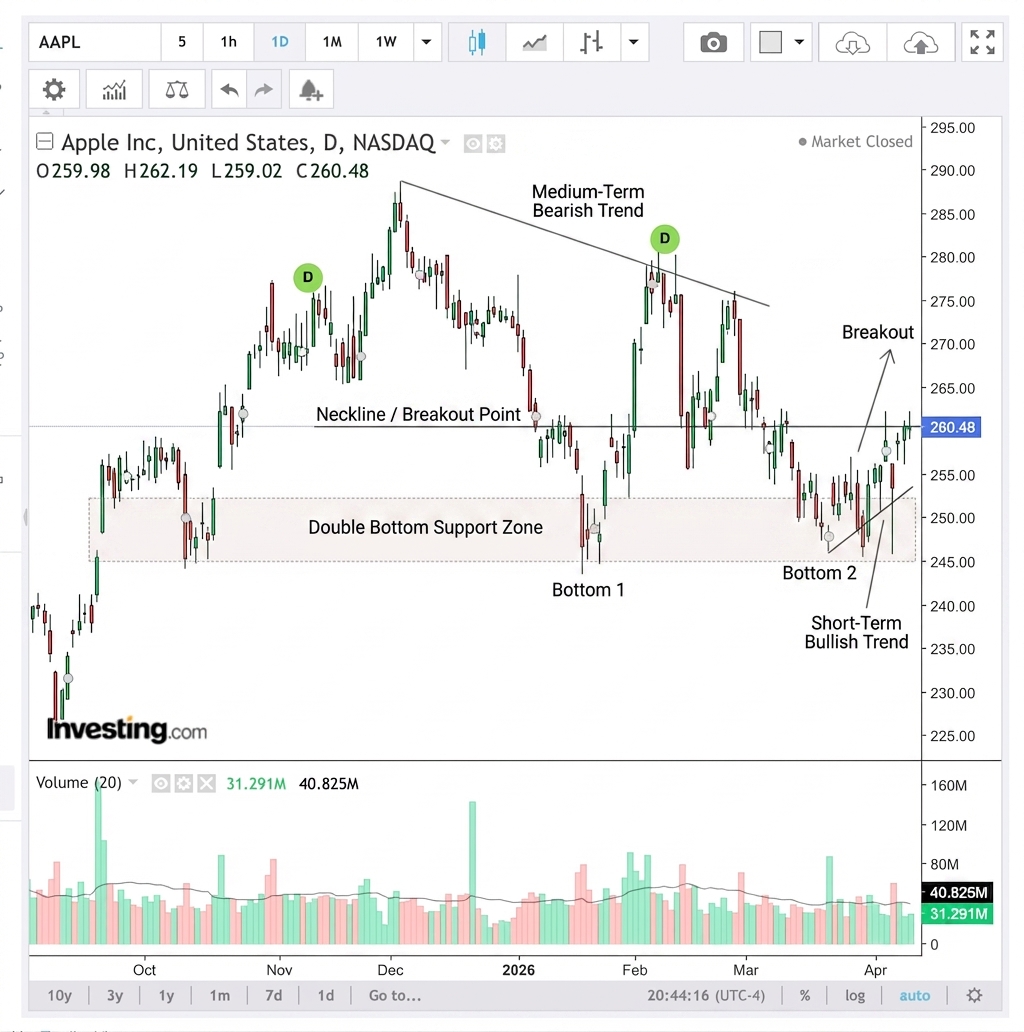
AAPL has formed a short-term double bottom reversal pattern at a key support zone and is currently breaking out, suggesting a continuation of the relief rally.
Trend
While the overarching medium-term structure is bearish following a sharp decline from its peak, the immediate short-term trend has shifted bullish. The price has established a higher low and experienced a momentum shift upwards, indicating buyers are stepping in at these discounted levels.
Patterns
A clear 'W' or double-bottom potential reversal pattern is evident with foundational support found in the 245.00-250.00 region. The price has recently pushed above the neckline/midpoint of this structure, validating the bullish setup.
Indicators
Recent daily bars have closed near their highs, demonstrating sustained intraday buying pressure. Volume profiling indicates that sell-offs are drying up and accumulation is beginning at current levels, supporting the bullish narrative.
Strategy
Initiate a long position at current market levels to capitalize on the confirmed breakout from the localized range. Maintain a tight stop loss just below key support to protect against a trend resumption downwards, and target predefined historical resistance levels for profit realization.
For reference only, not investment advice. Trading decisions are your own.