032640 Sell analysis
- Confidence
- 85
- Entry
- 15,170
- Target
- 14,200
- Stop
- 16,250
- Published
- 2026-05-08
Summary
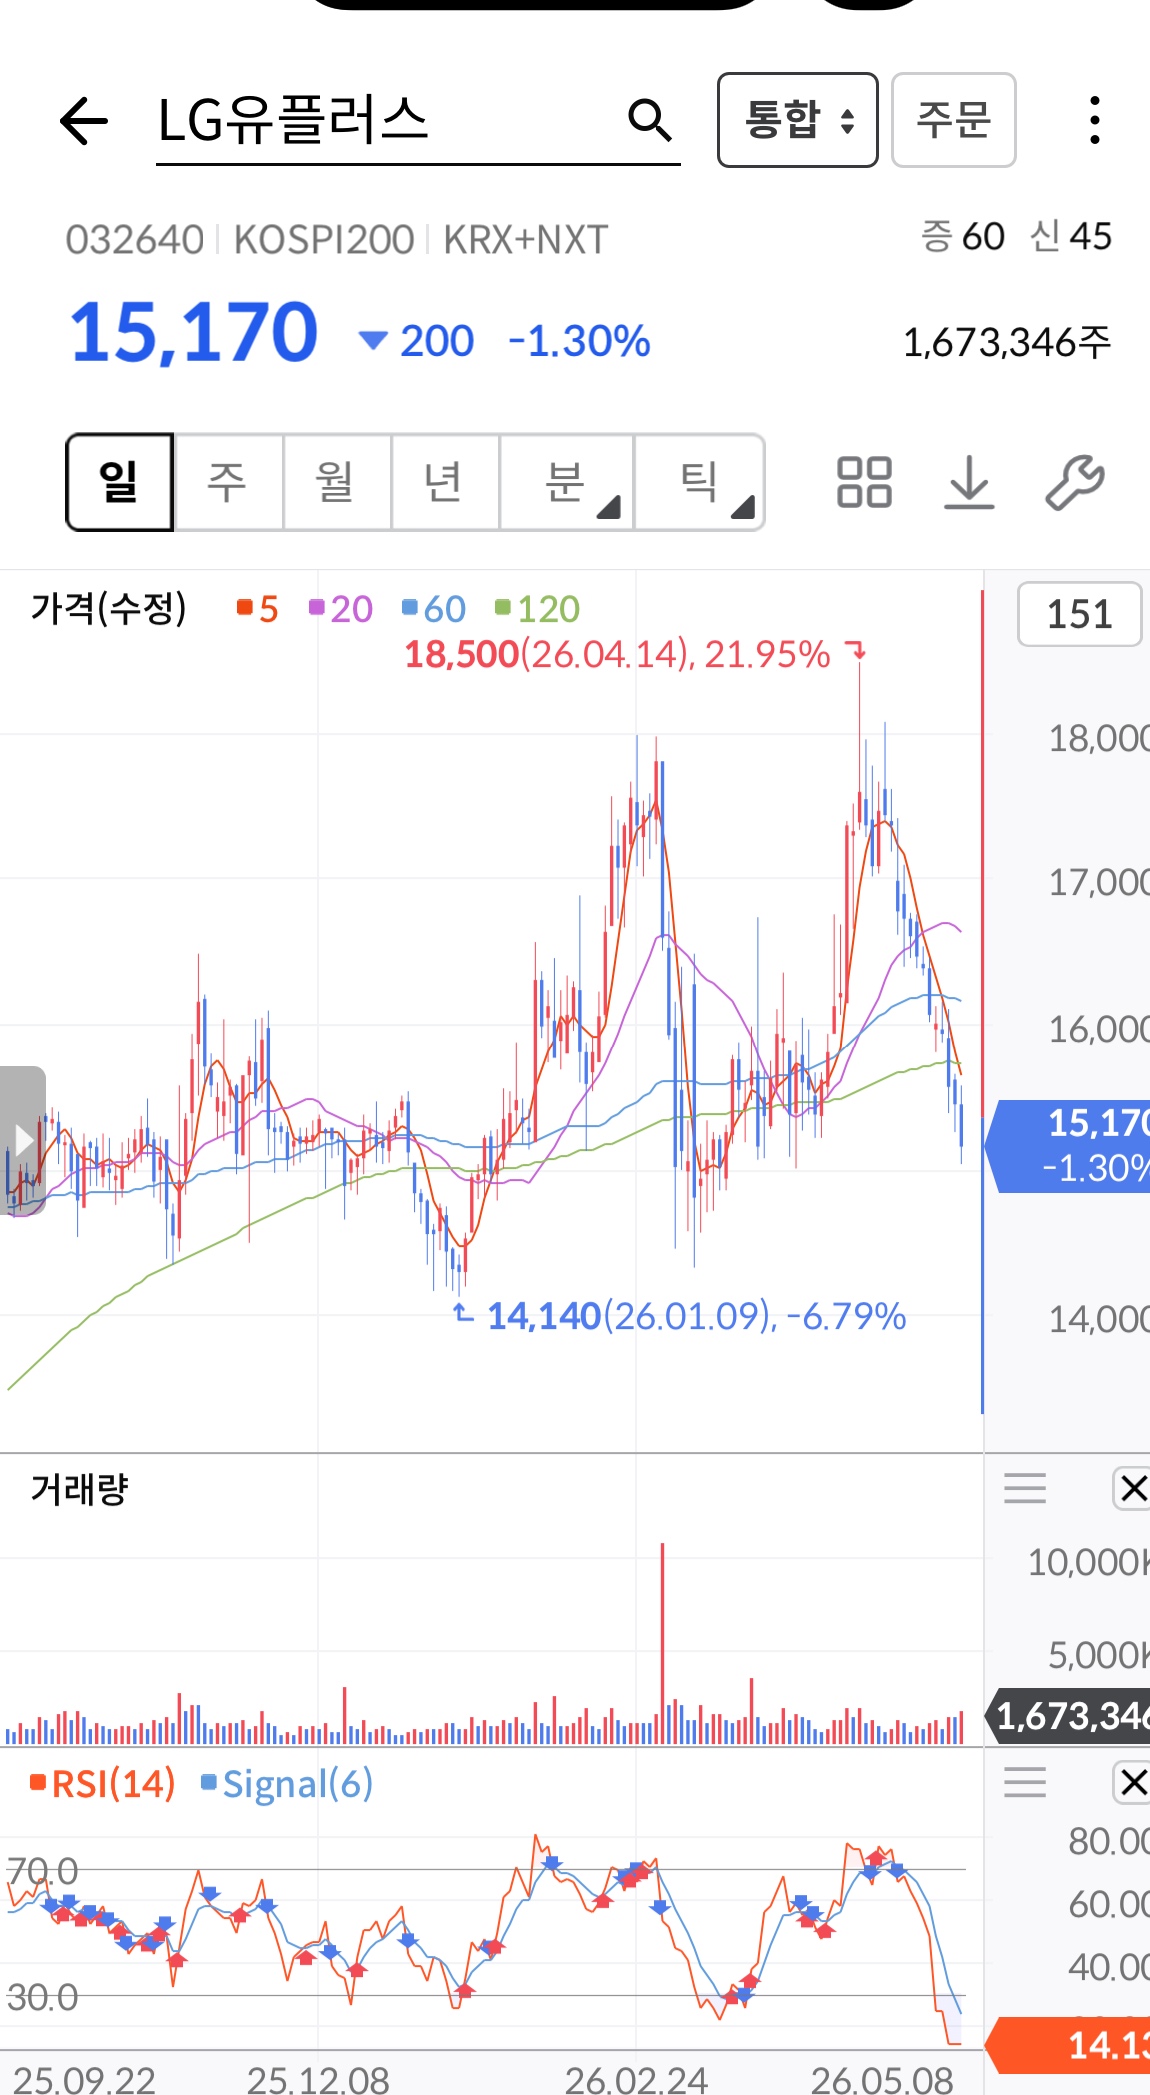
The asset is experiencing strong bearish momentum, in a steep downtrend following a double top reversal pattern.
Trend
The price is currently trading firmly below all key moving averages visible on the chart (the 5, 20, 60, and 120-period lines). The shorter-term moving averages have aggressively crossed below the longer-term ones, confirming a robust and active downward trend. There is a distinct sequence of strong lower highs and lower lows characterizing the recent price action.
Patterns
A pronounced double top formation was established near the 18,000 price level. The subsequent rapid breakdown below the support zones around 16,000 has validated this bearish reversal pattern and accelerated the sell-off.
Indicators
The moving averages are demonstrating a full bearish alignment, acting as dynamic resistance above the price. The RSI (Relative Strength Index) at the bottom is notably low, dipping below the 15 mark into extreme oversold territory. While this extreme reading signals the potential for a short-term technical bounce or 'dead-cat bounce', the dominant trend is so powerfully negative that it remains extremely risky to attempt to buy the dip without a confirmed reversal structure.
Strategy
The primary strategic stance is bearish. Traders should avoid attempting to 'catch a falling knife'. Existing long positions are under severe pressure. Because of the extremely oversold RSI, a brief relief rally is possible; however, such counter-trend bounces should run into heavy resistance at former support levels (like 16,000) and would present higher-probability shorting opportunities rather than safe buy entries. The immediate downside target is the previous significant swing low.
For reference only, not investment advice. Trading decisions are your own.