RZLV Hold analysis
- Confidence
- 65
- Entry
- 4,600
- Target
- 7,500
- Stop
- 3,400
- Published
- 2026-05-12
Summary
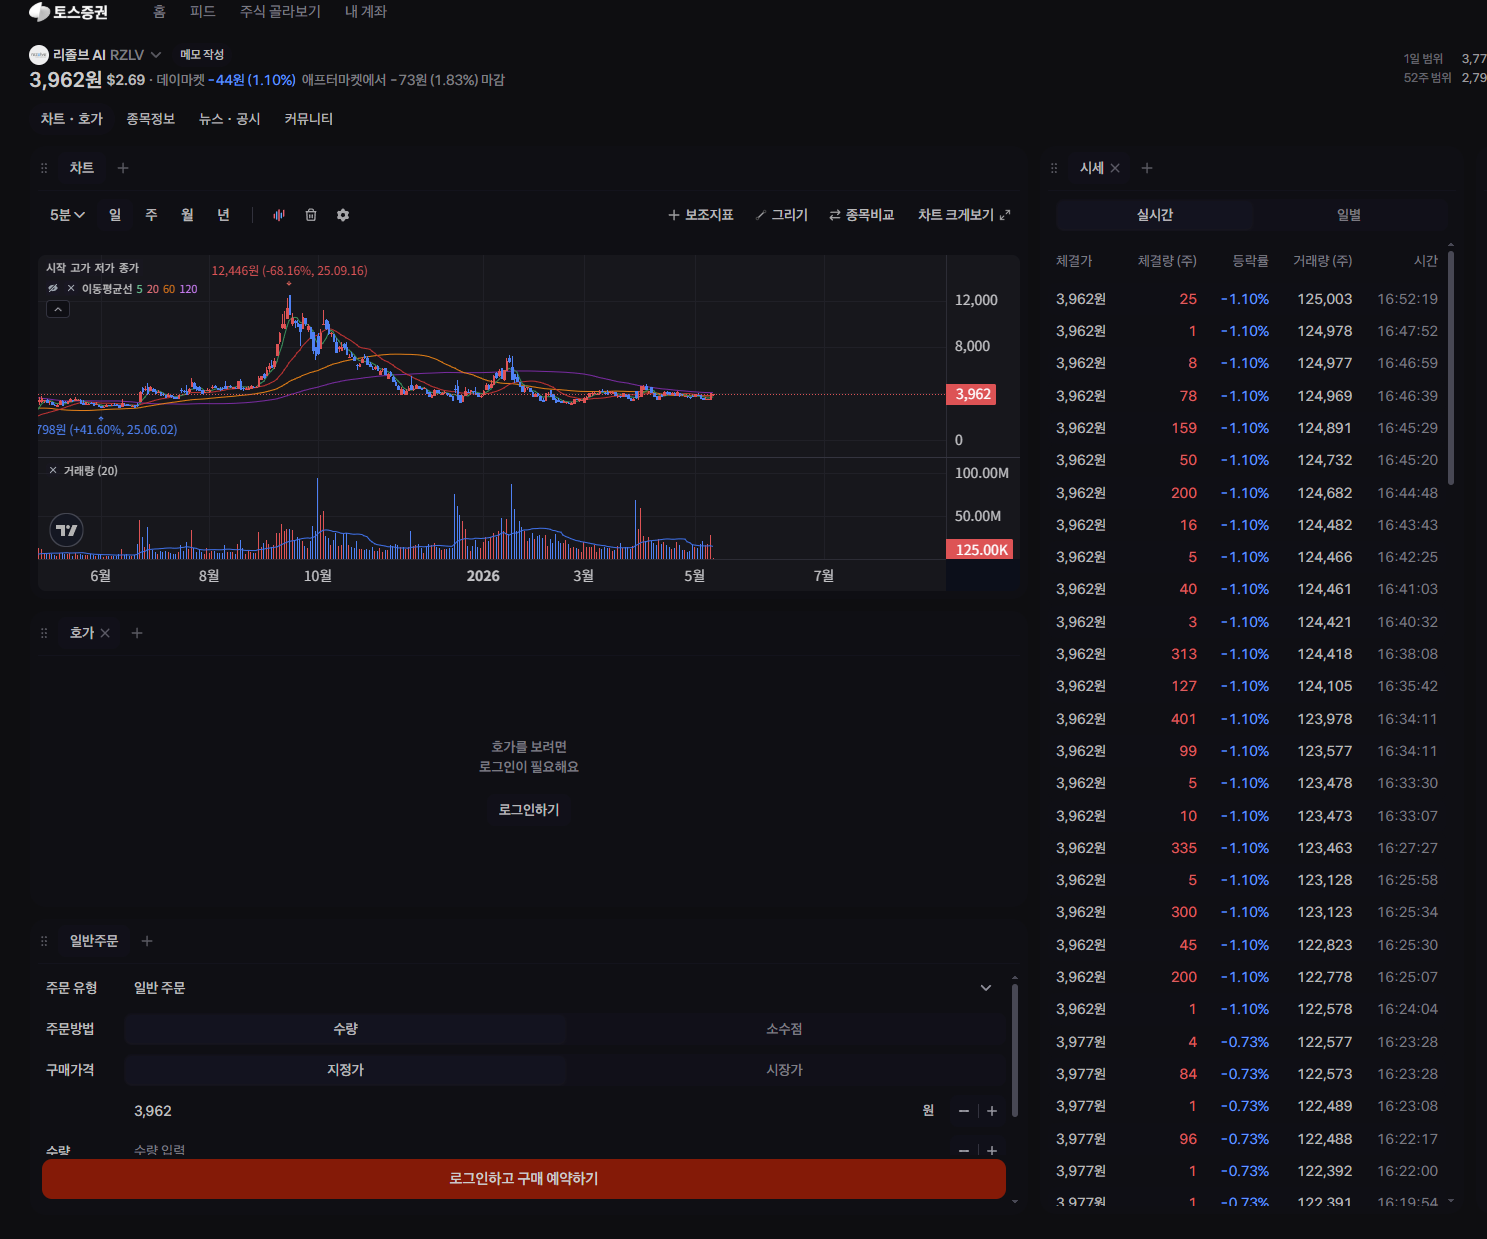
The stock is currently in a prolonged consolidation phase following a significant downtrend, with declining volume indicating low current market interest.
Trend
After reaching a peak near 12,000, the stock experienced a steep downtrend. It has since flattened out and is currently trading sideways, indicating a lack of clear directional momentum. The moving averages (5, 20, 60, 120) appear clustered and somewhat flat, confirming the current range-bound environment.
Patterns
The chart displays a classic 'pump and dump' or sharp climax followed by an extended accumulation or distribution phase. The current price action is forming a horizontal channel with low volatility.
Indicators
Moving averages are converging, suggesting consolidation. Volume has dried up significantly since the peak, showing a lack of buying pressure to initiate a new uptrend or selling pressure for a further breakdown.
Strategy
Wait for a definitive breakout from the current consolidation range. A high-volume move above key resistance around 4,500-5,000 would signal a potential trend reversal and offer a long entry. Conversely, a breakdown below the 3,500 support level could indicate further downside. Current setup is best suited for patience.
For reference only, not investment advice. Trading decisions are your own.