BTCUSD Sell analysis
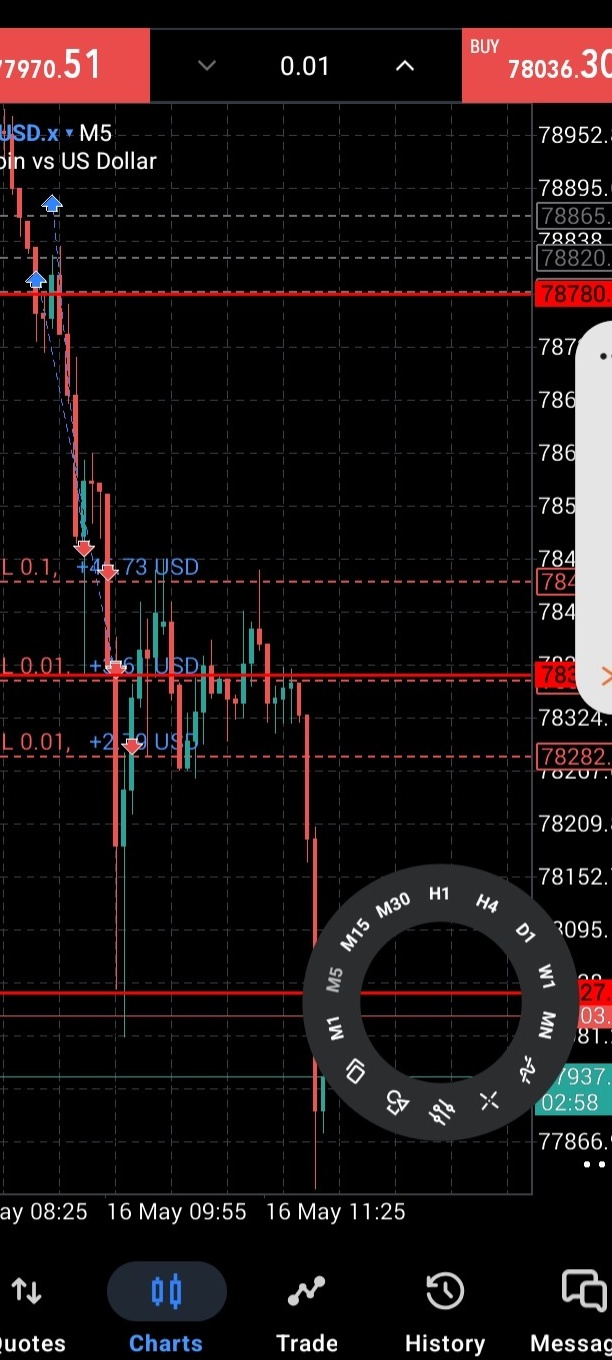
- Confidence
- 85
- Entry
- 78,282
- Target
- 77,500
- Stop
- 78,400
- Published
- 2026-05-16
Summary
The asset is exhibiting a strong downtrend characterized by a recent significant drop and a failure to break above resistance levels during a consolidation phase, suggesting further downside potential.
Trend
The overall trend is strongly bearish. The price action shows a series of lower highs and lower lows, punctuated by a consolidation phase. Most recently, another sharp decline has broken below the consolidation range, confirming the continuation of the downtrend.
Patterns
The chart shows a strong initial drop followed by a period of consolidation (a bear flag or rectangle pattern). The price recently broke down from this consolidation area, which is a bearish continuation signal.
Indicators
The price is trading well below moving average lines (implied, not explicitly visible but consistent with price action). There's high selling pressure evident from the long red candles. The breakdown below horizontal support levels reinforces the bearish momentum.
Strategy
Initiate a short position (sell) as the price has broken below the recent consolidation support. Set a stop-loss above the breakdown point to manage risk if the breakdown is false. Target the next historical support levels for profit-taking.
For reference only, not investment advice. Trading decisions are your own.