USD/PHP OTC Buy analysis
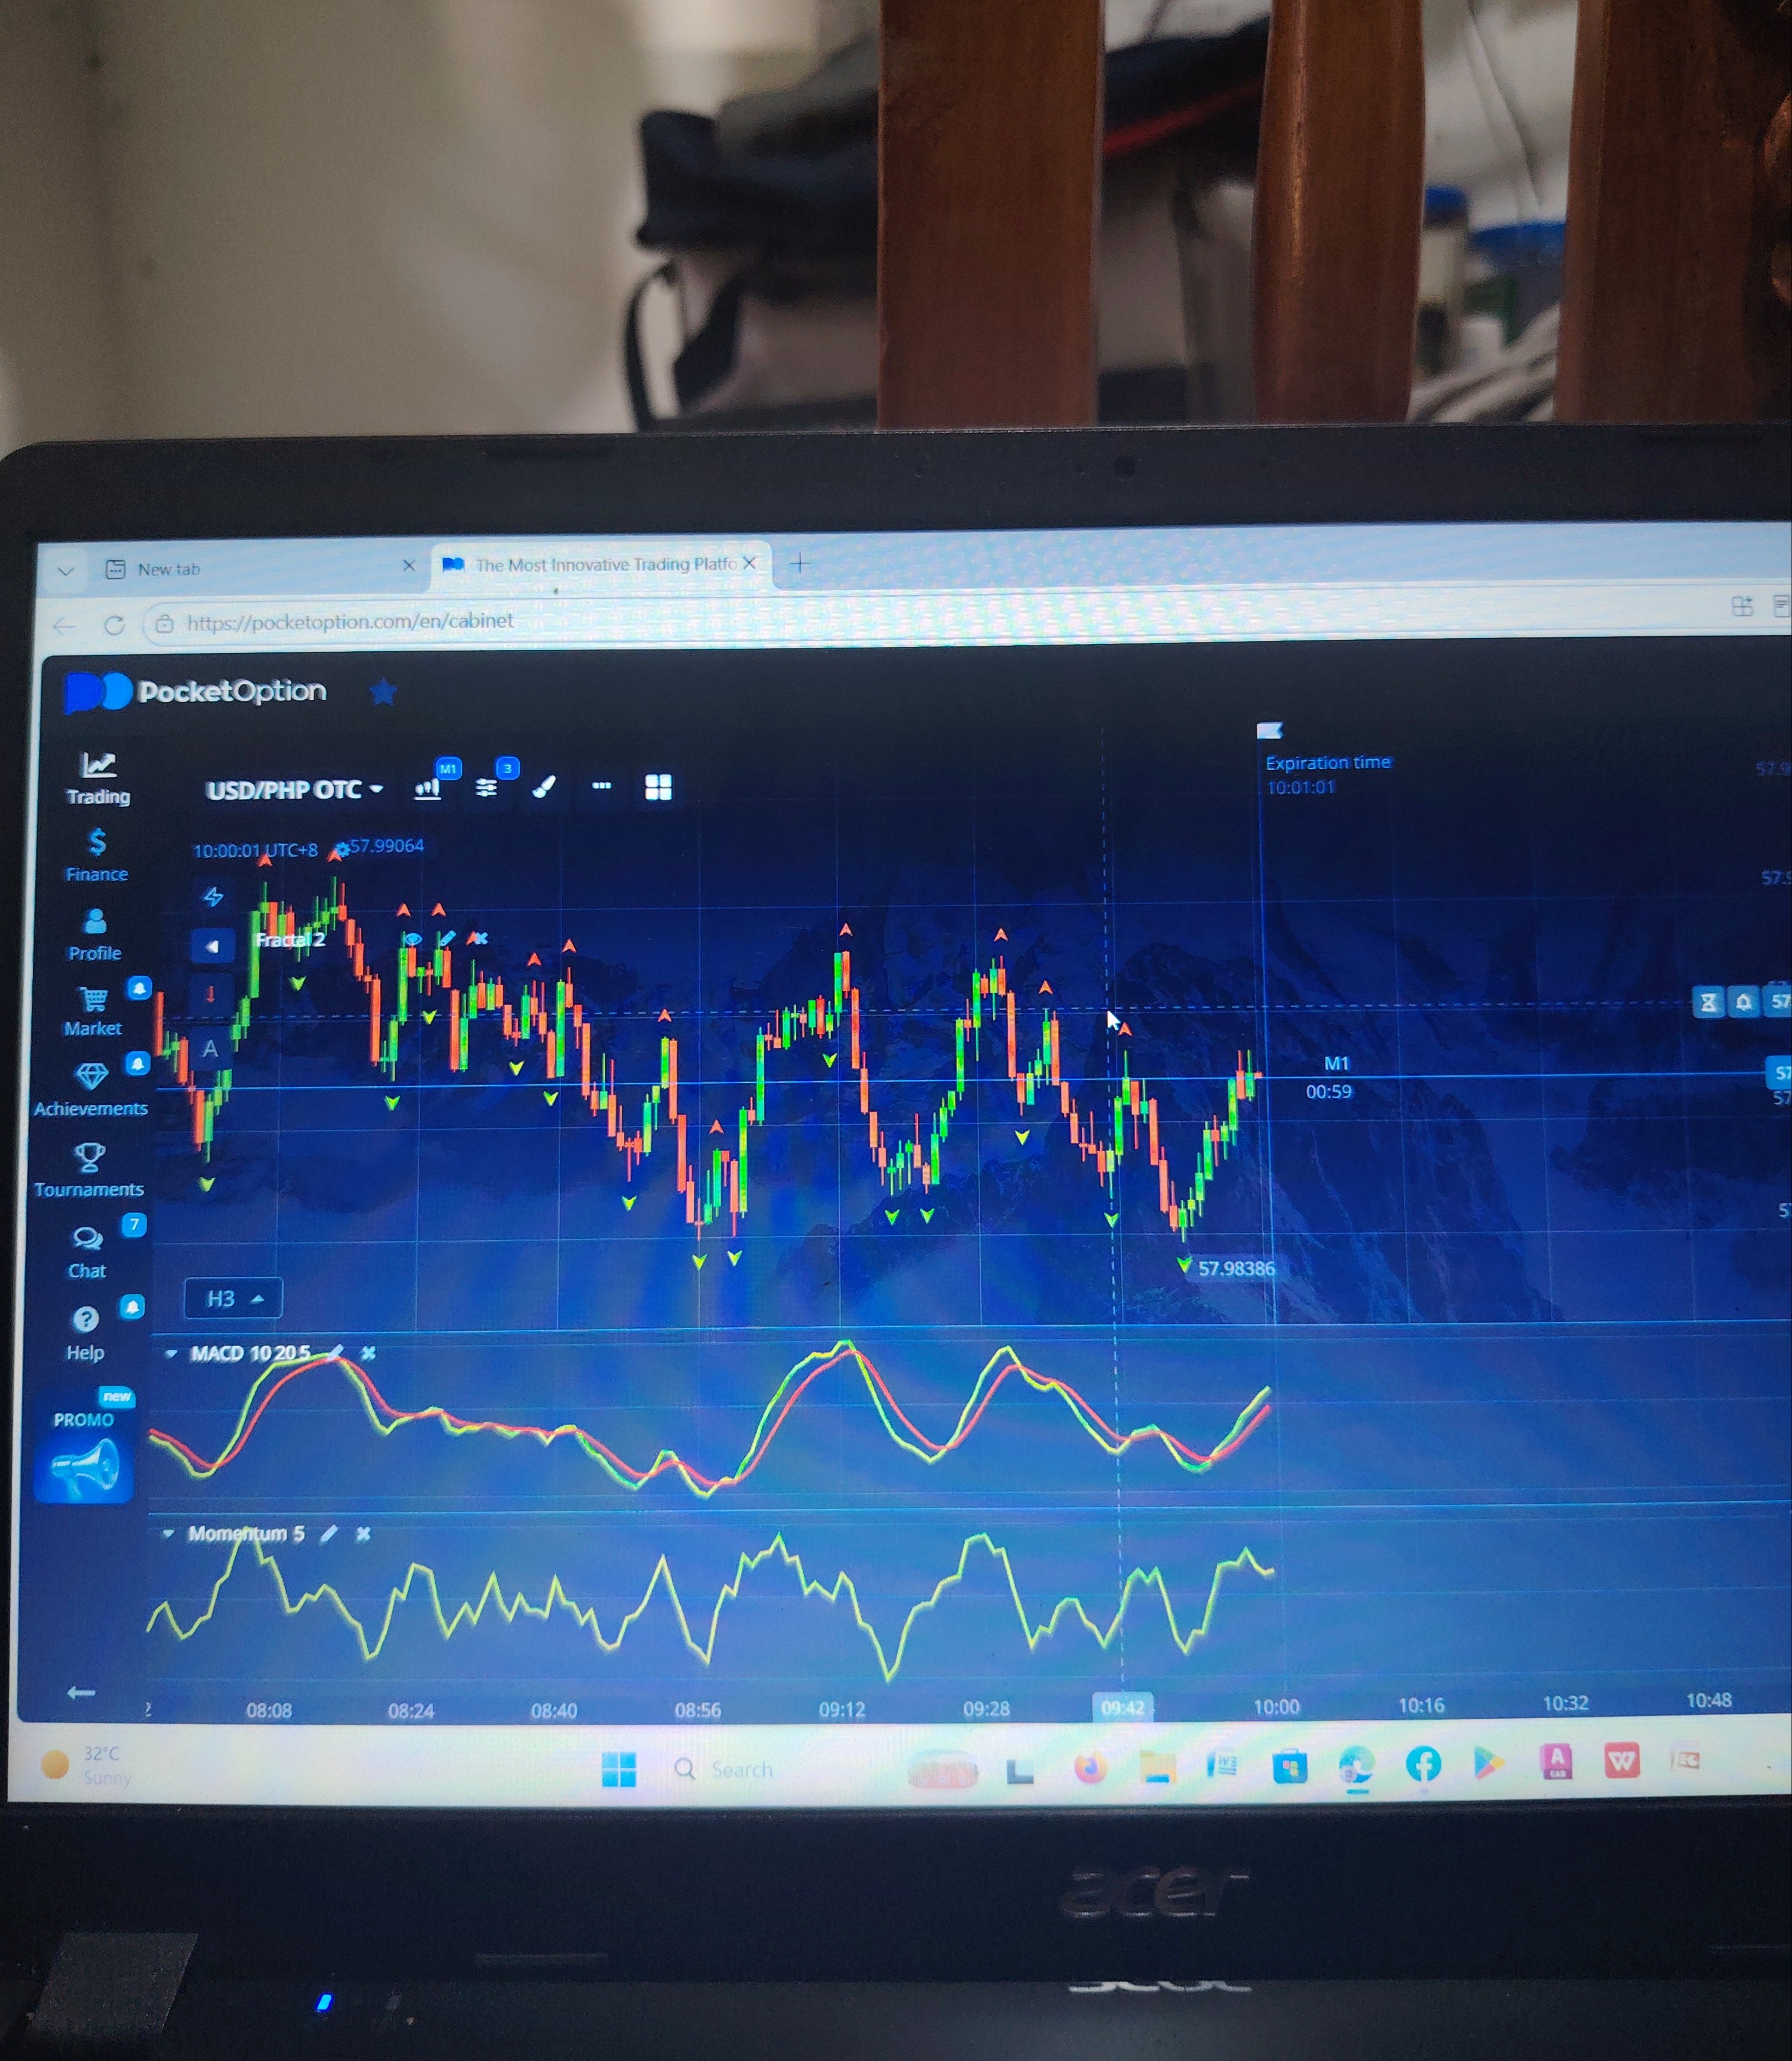
- Confidence
- 75
- Entry
- 57.986
- Target
- 57.990
- Stop
- 57.983
- Published
- 2026-05-25
Summary
Short-term bullish reversal indicated by a double bottom support test and a bullish MACD crossover on the 1-minute chart.
Trend
The price has recently touched a support bottom near 57.98386 and is beginning a short-term upward recovery phase, breaking the local downward micro-trend.
Patterns
A potential double bottom pattern has formed near the local low of 57.98386, followed by strong green candle reaction upward.
Indicators
The MACD (10, 20, 5) shows a fresh bullish crossover with the green line crossing above the red line. The Momentum (5) indicator is also rising sharply, indicating short-term buying pressure is increasing.
Strategy
Enter buy position at the current level with a tight stop loss just below the recent swing low to capitalize on the short-term upward momentum towards the prior minor resistance.
For reference only, not investment advice. Trading decisions are your own.