BTCUSD Buy analysis
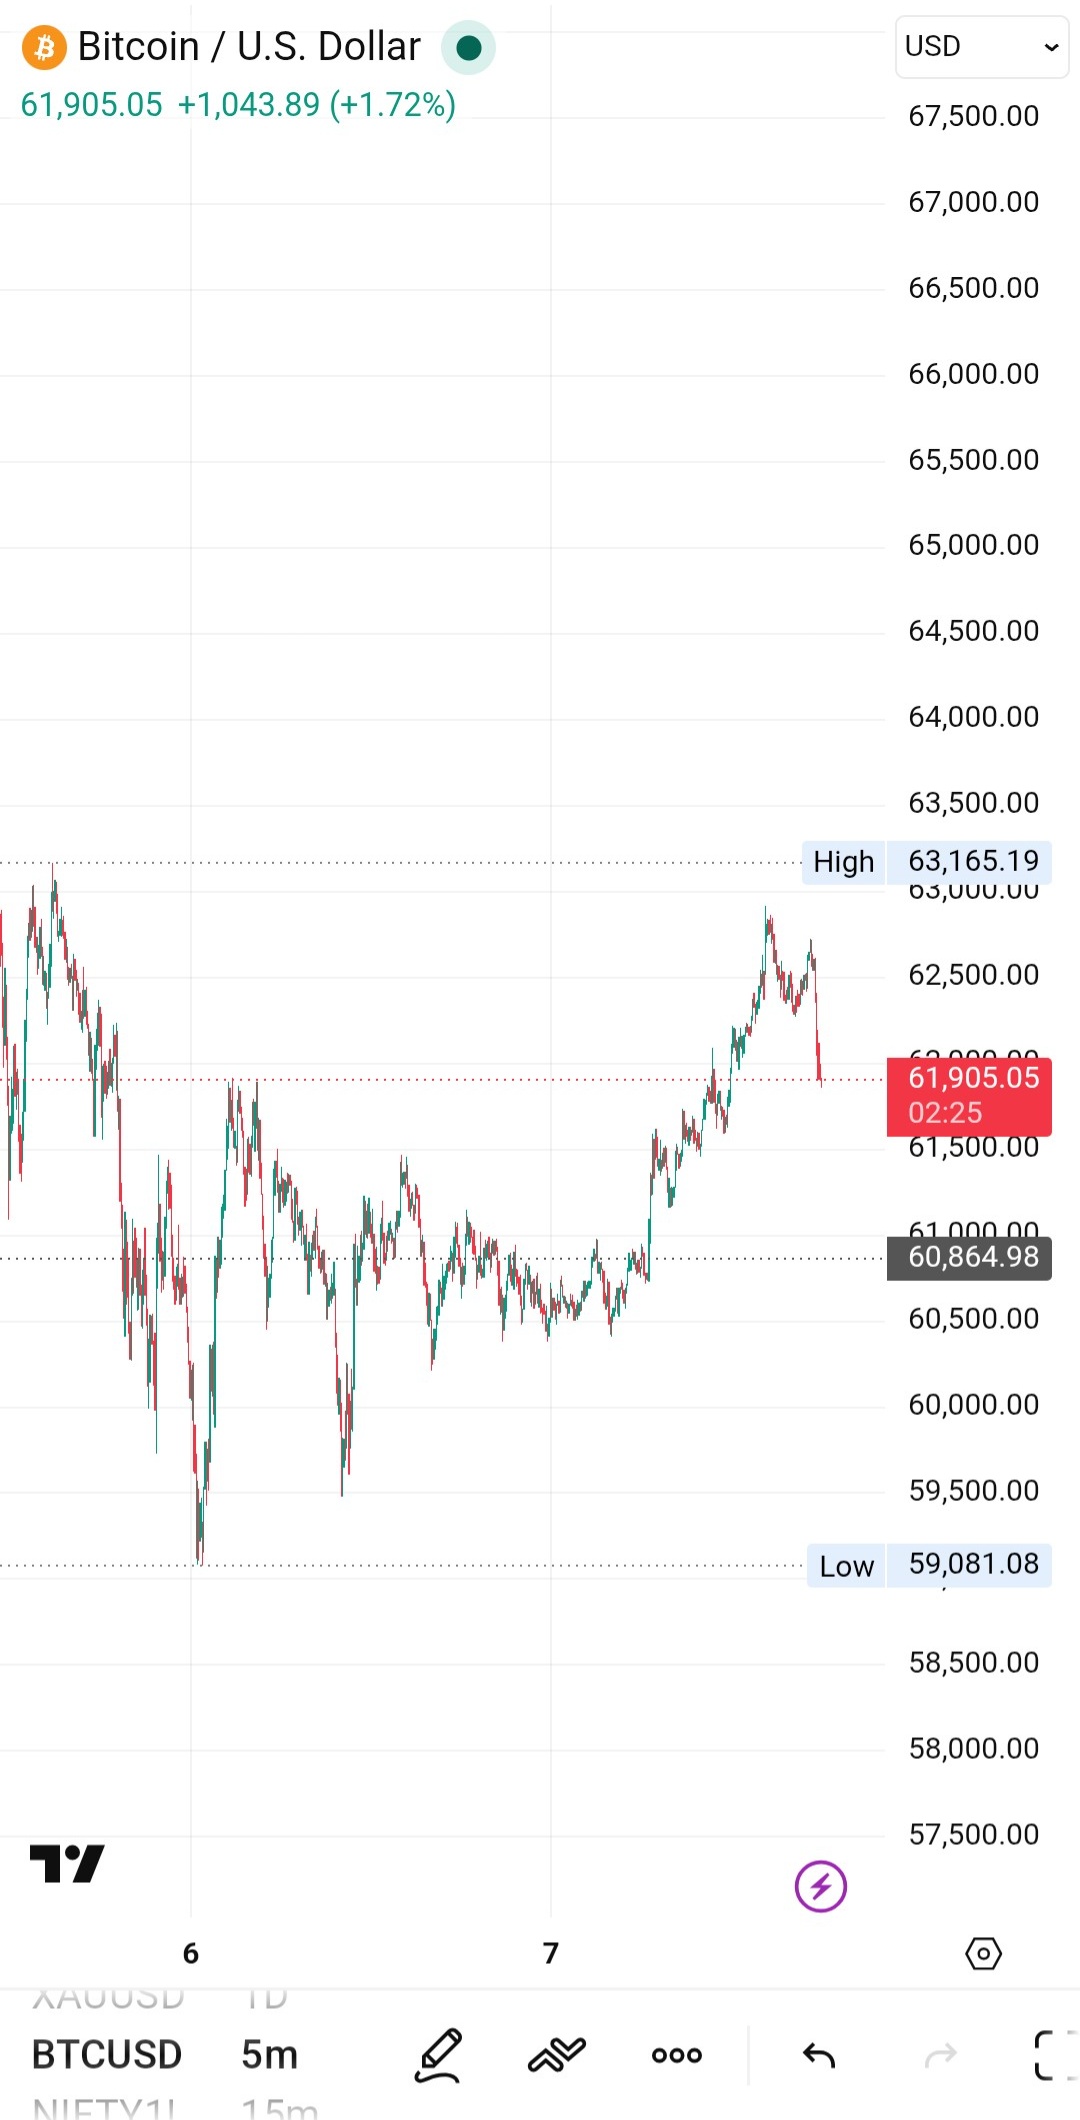
- Confidence
- 75
- Entry
- 61,905
- Target
- 63,165
- Stop
- 60,750
- Published
- 2026-06-07
Summary
Strong intraday recovery and breakout above the consolidative base suggest bullish continuation after the current brief pullback.
Trend
The short-term trend has reversed from a bearish decline (bottoming near $59,081) to a bullish structure, characterized by a series of higher lows and a sharp impulse wave to the upside.
Patterns
A clear double-bottom structure developed near $59,081 - $59,500, followed by a successful breakout above the accumulation zone around $61,000.
Indicators
The current rapid decline from the local high is a standard pullback to test previous resistance turned support near the $61,500 - $61,900 zone. Volume on the leg up indicates strong buying interest.
Strategy
Enter long at the current levels on this pullback, anticipating a bounce off the newly established support zone to retest the local swing highs. Use a strict stop loss below the major breakout level.
For reference only, not investment advice. Trading decisions are your own.