BTCUSD Buy analysis
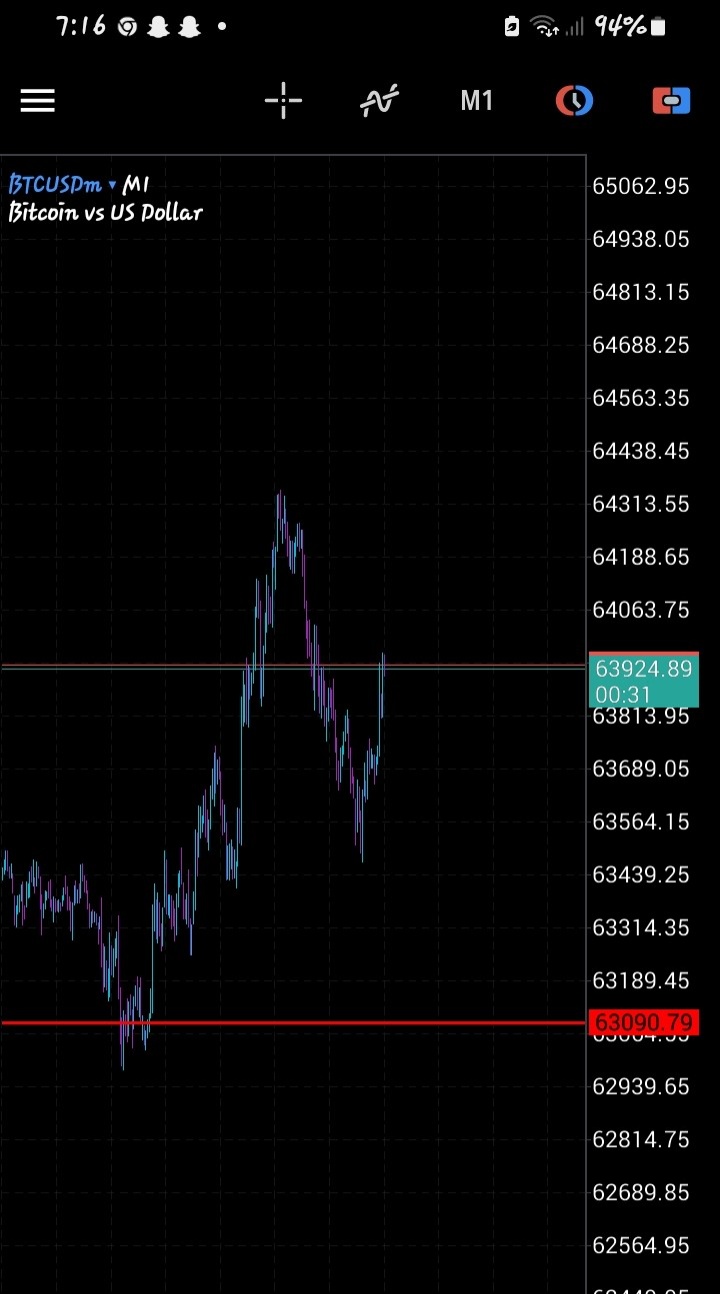
- Confidence
- 75
- Entry
- 63,924
- Target
- 64,313
- Stop
- 63,450
- Published
- 2026-06-12
Summary
Bitcoin is displaying a bullish structure on the M1 timeframe after established support and a clear higher low, pointing to a continuation of intraday upward momentum.
Trend
The short-term trend has shifted to bullish on this 1-minute chart. After bottoming near the major support level of $63,090, the price saw an impulsive leg up to $64,313, followed by a corrective pullback that successfully held a higher low near $63,500.
Patterns
A classic higher-low structure has formed, suggesting a trend reversal from the previous downward pressure and a continuation towards the local highs.
Indicators
Strong price action rejection at the lower levels and a rapid recovery candle crossing $63,924 indicate that bulls are currently in control on this micro-timeframe.
Strategy
Enter long at the current breakout level of $63,924, aiming for a retest of the recent swing high with a tight stop loss placed just below the recent higher low to limit downside risk.
For reference only, not investment advice. Trading decisions are your own.