BCHUSD Buy analysis
- Confidence
- 70
- Entry
- 189.79
- Target
- 204.00
- Stop
- 184.50
- Published
- 2026-06-20
Summary
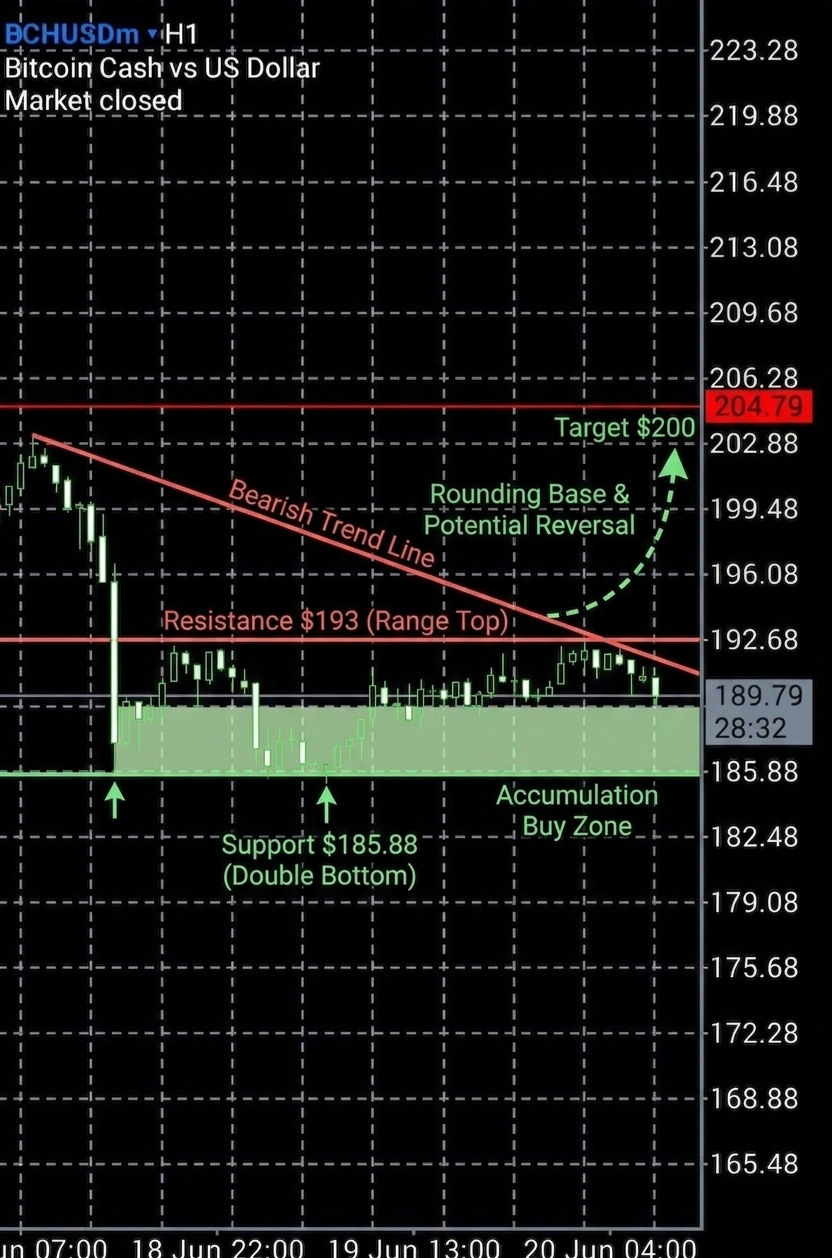
Bitcoin Cash (BCHUSD) is showing signs of base-building and stabilization after a sharp drop, presenting a high risk-to-reward buying opportunity near local support.
Trend
The short-term trend on the hourly chart shows a steep decline from above $200 down to the $185.88 level, where sellers exhausted. Price has since entered a sideways consolidation range between $186 and $193, suggesting a shift from a bearish trend to accumulation.
Patterns
The price action has formed a solid double bottom support near $185.88. The subsequent sideways movement looks like a rounding accumulation base, preparing for a potential trend reversal back towards the psychological $200 level.
Indicators
The market is currently flat and consolidating just below the local overhead resistance of $192.68. A break above this minor level would confirm the bullish reversal pattern.
Strategy
Enter long at the current level or on mild pullbacks close to $189.79. Place a tight stop-loss below the swing low at $184.50, and set the target at the prominent red resistance line around $204.00.
For reference only, not investment advice. Trading decisions are your own.