BTC Sell analysis
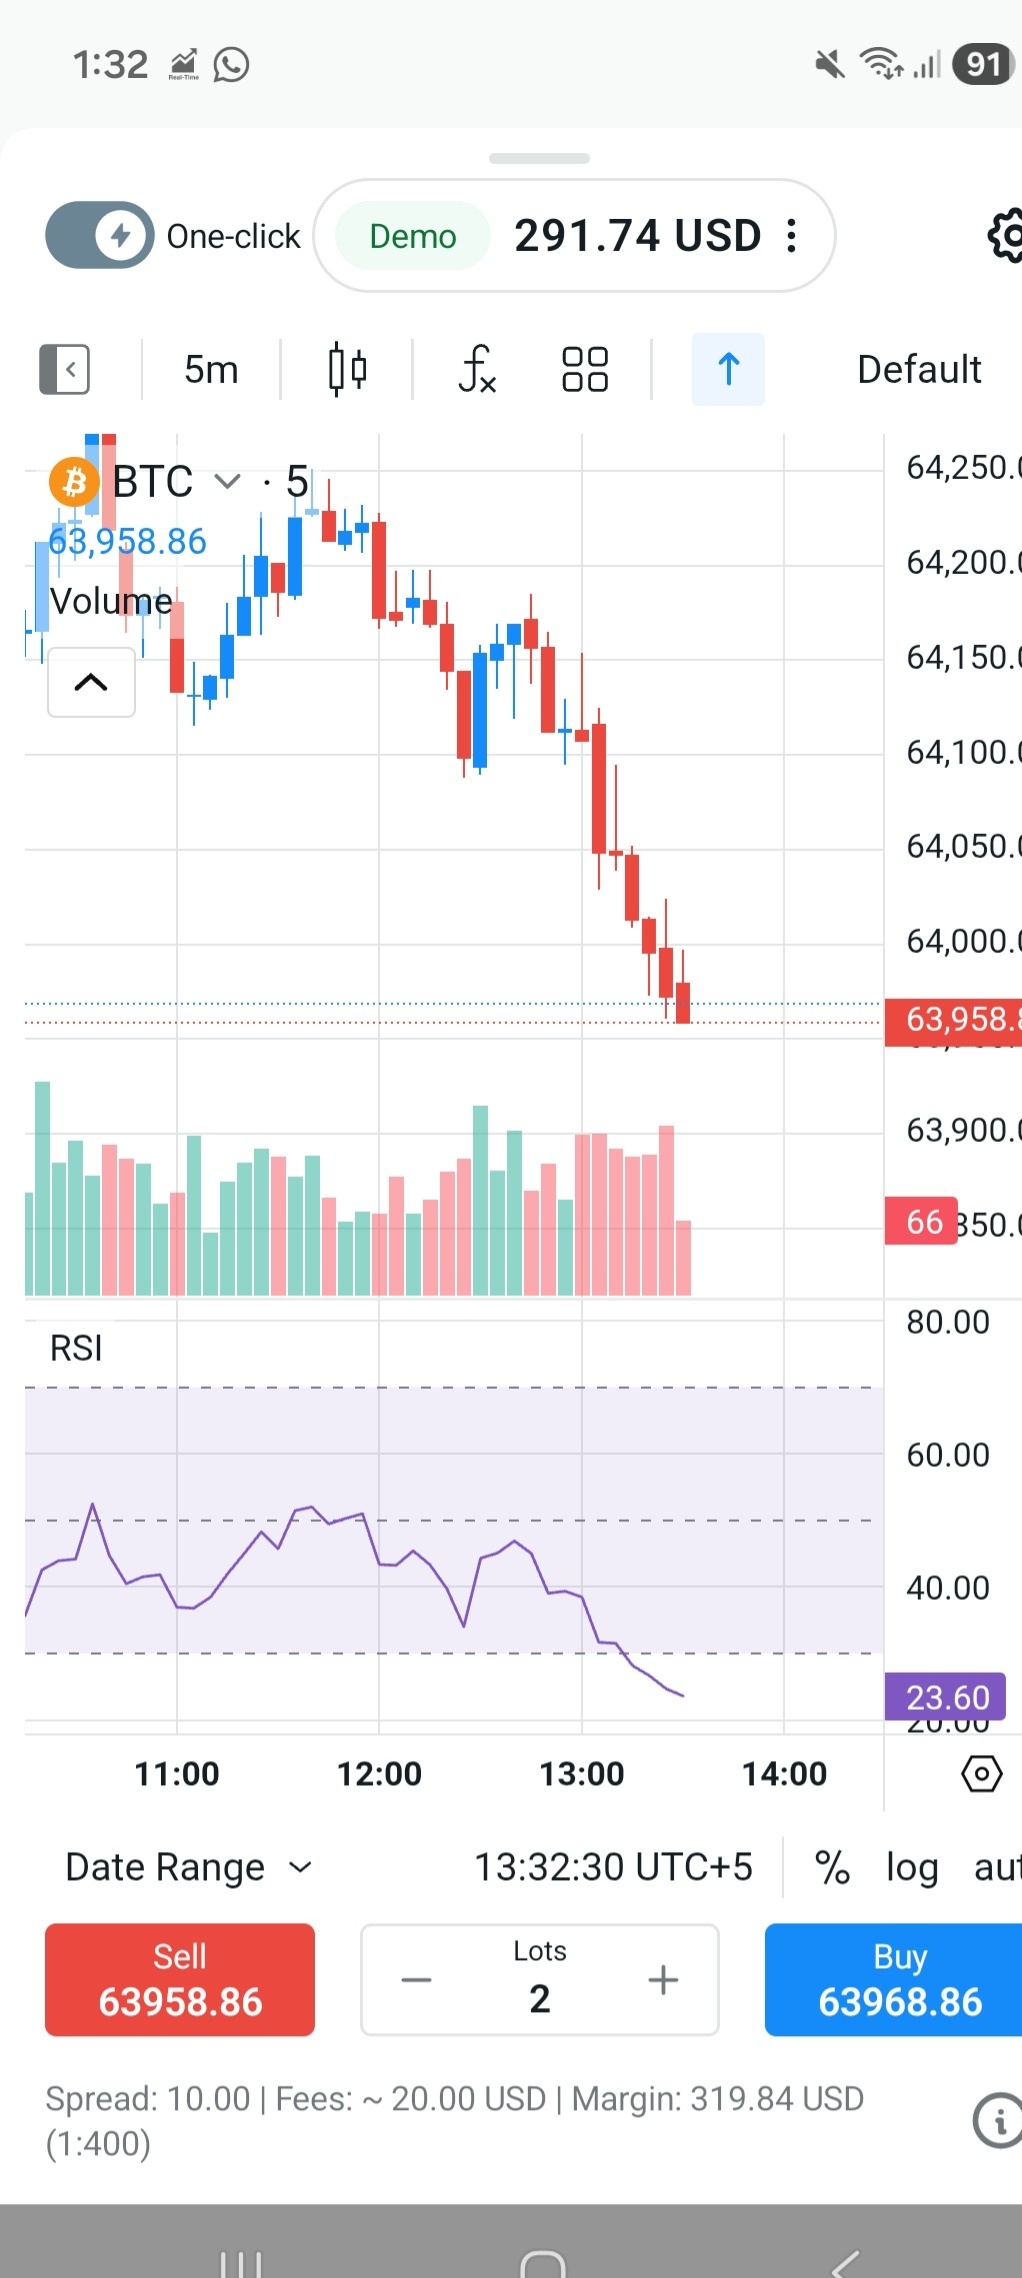
- Confidence
- 75
- Entry
- 63,958
- Target
- 63,500
- Stop
- 64,150
- Published
- 2026-06-21
Summary
Bitcoin is in a steep short-term decline, having recently broken below the key psychological level of 64,000 on high volume.
Trend
The 5-minute chart exhibits a strong bearish trend with consecutive red candles, accelerating downwards after breaching previous consolidation support near 64,100.
Patterns
A clear bearish breakdown pattern is observed, with prices piercing the 64,000 handle and no immediate signs of a demand response.
Indicators
The RSI has entered oversold territory at 23.60, indicating extreme selling pressure. While a short-term relief bounce is possible, the strong momentum suggests further downside before a sustainable reversal.
Strategy
Enter a short position at current market price or on a minor retest of the broken 64,000 level, placing a stop-loss just above the breakdown point to manage risk.
For reference only, not investment advice. Trading decisions are your own.