BTCUSD Sell analysis
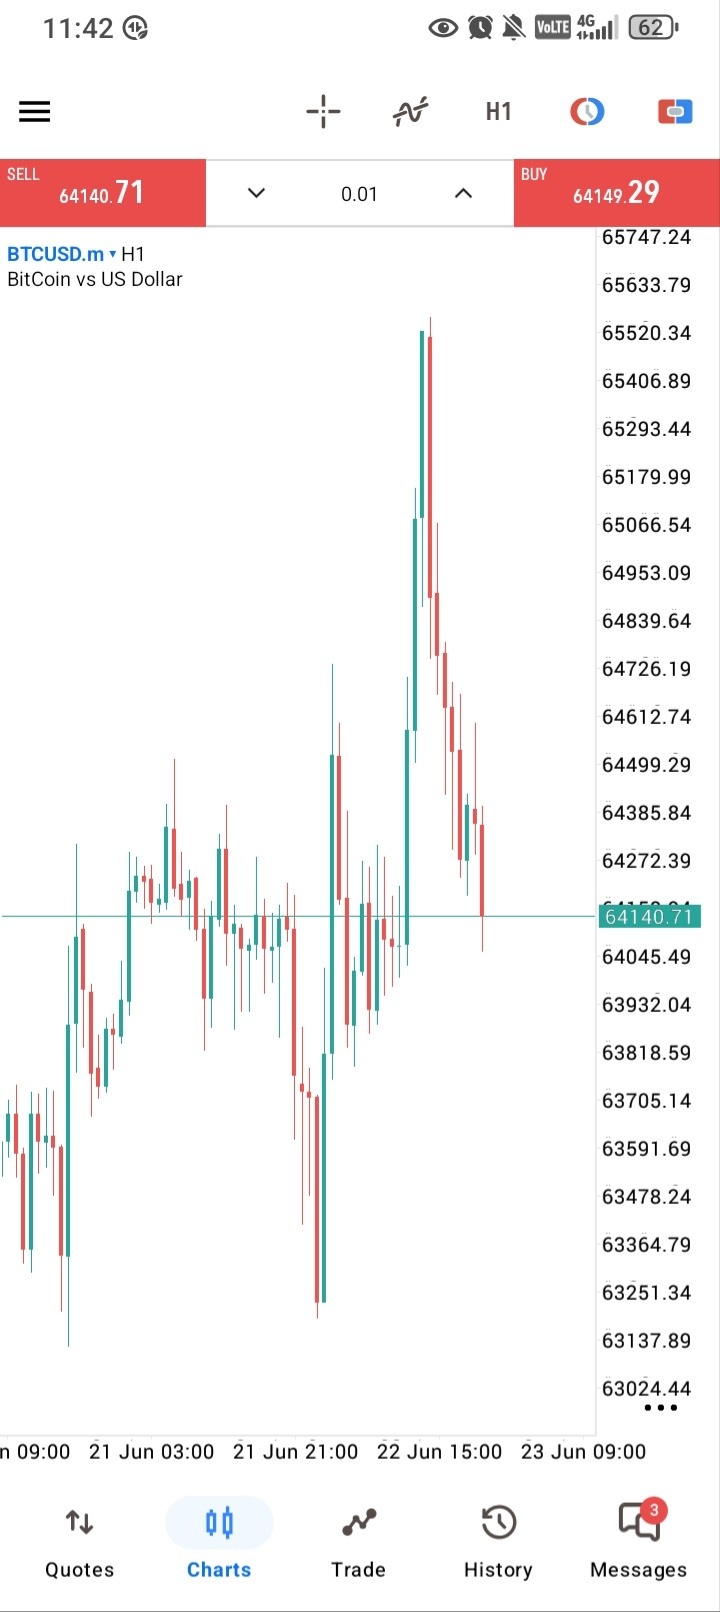
- Confidence
- 75
- Entry
- 64,140
- Target
- 63,250
- Stop
- 64,650
- Published
- 2026-06-22
Summary
Bearish momentum dominates after a sharp rejection at the 65,520 resistance, indicating a continuation towards lower support levels.
Trend
The short-term trend on the H1 chart has turned strongly bearish. After a rapid spike to approximately 65,520, the price faced a swift rejection and has been printing consecutive bearish candles, breaking below local minor supports.
Patterns
A clear 'pump and dump' rejection pattern at the local peak, with consecutive bearish candles indicating aggressive distribution.
Indicators
The price action shows strong downward momentum, breaking through the 64,200 support level, clearing the path towards the next major liquidity pool located near the prior swing lows.
Strategy
Enter short near the current price to capitalize on the downward momentum toward the next significant support floor, with a tight stop loss above the immediate minor resistance.
For reference only, not investment advice. Trading decisions are your own.