BTCUSD Sell analysis
- Confidence
- 75
- Entry
- 60,500
- Target
- 58,500
- Stop
- 61,500
- Published
- 2026-06-26
Summary
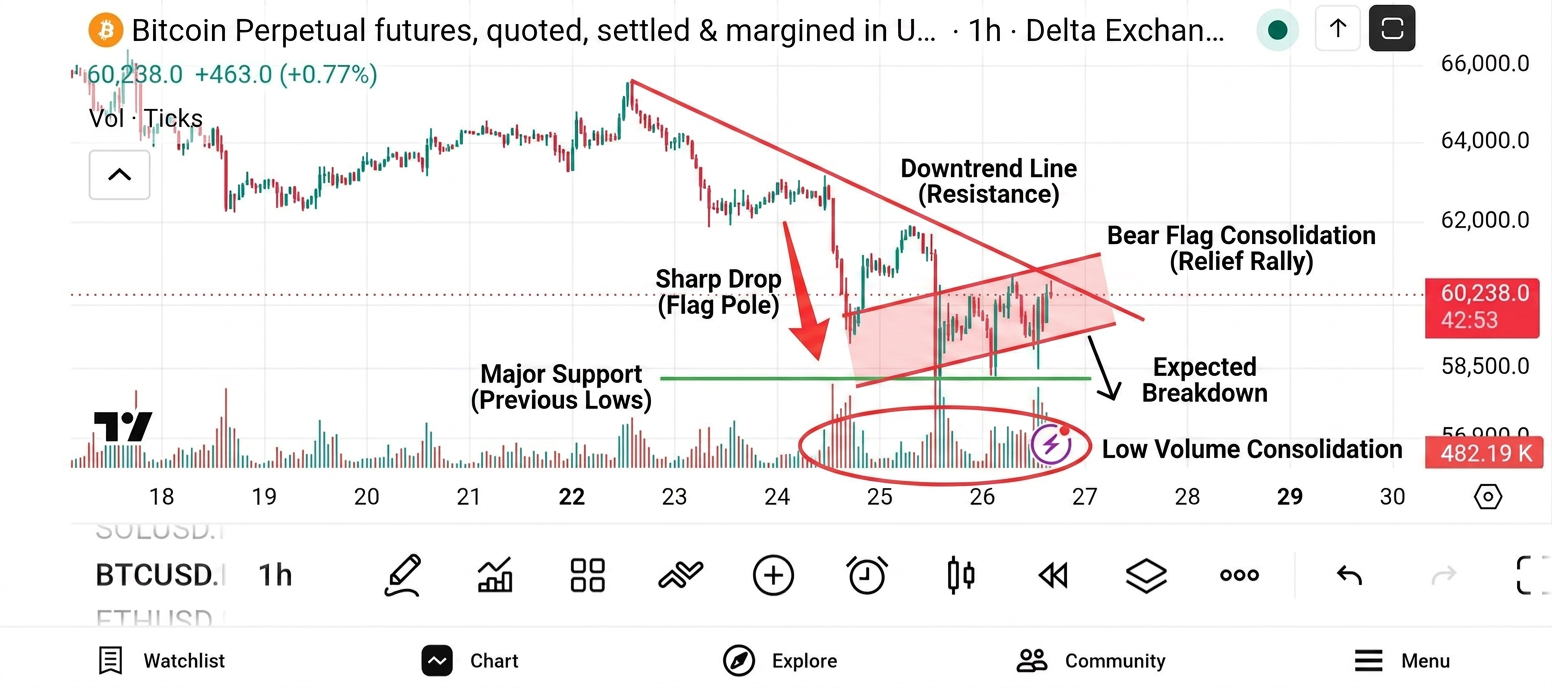
Bitcoin remains in a clear short-term downtrend on the hourly chart, with the current bounce likely representing a corrective relief rally before further downside.
Trend
The 1-hour chart displays a market structure characterized by lower highs and lower lows, descending from above 65,000 to lows near 58,000. The dominant trend is bearish.
Patterns
The price action suggests a bearish continuation, where the sharp drop on the 24th-25th is followed by a weak, low-volume consolidation/bear flag structure.
Indicators
Slight volume contraction on the recent rebound indicates a lack of solid buying conviction, keeping the bias firmly to the downside.
Strategy
Enter short positions on strength near the 60,500 resistance level. Place a stop loss above the recent consolidation high and aim for a retest of the recent support lows.
For reference only, not investment advice. Trading decisions are your own.