TAO Sell analysis
- Confidence
- 75
- Entry
- 205
- Target
- 150
- Stop
- 235
- Published
- 2026-06-29
Summary
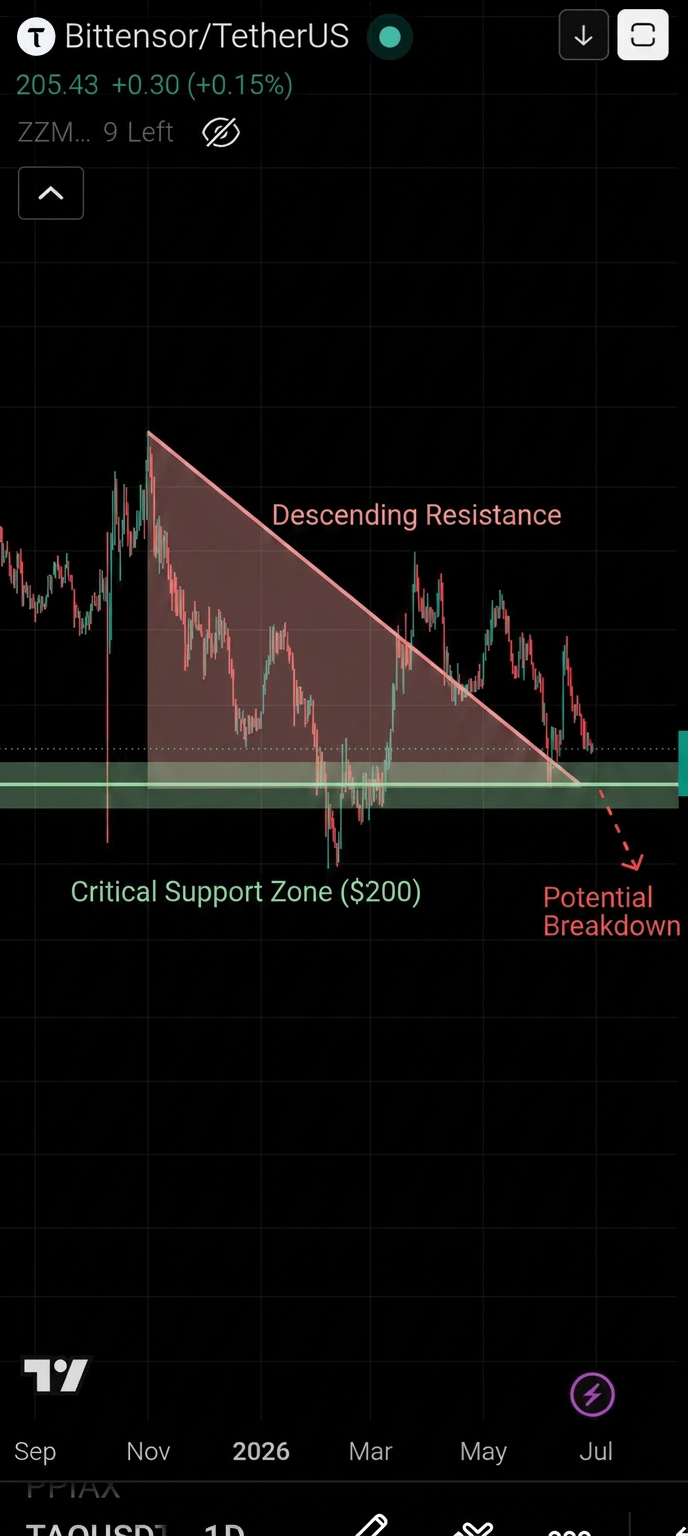
TAO/USDT is displaying a clear bearish market structure, making consecutive lower highs and currently retesting a critical horizontal support level near $200.
Trend
The medium to long-term trend is firmly bearish, characterized by a series of lower highs and lower lows. The price is currently pressuring the support zone around $200, which has been tested multiple times, typically weakening the support over time.
Patterns
The price action exhibits a descending triangle-like distribution pattern, where sellers are aggressively pushing the price back down to the $200 baseline support, signaling a high probability of a breakdown.
Indicators
Sellers remain in complete control with strong bearish momentum leading into the support line, showing no signs of major bullish divergence or significant buy-back tails.
Strategy
Enter a short position at current levels or on a confirmed daily close below the key $200 support level. Target the next historical support region around $150, while keeping a stop loss above the recent local high of $235 to manage risk.
For reference only, not investment advice. Trading decisions are your own.