Chart Buy analysis
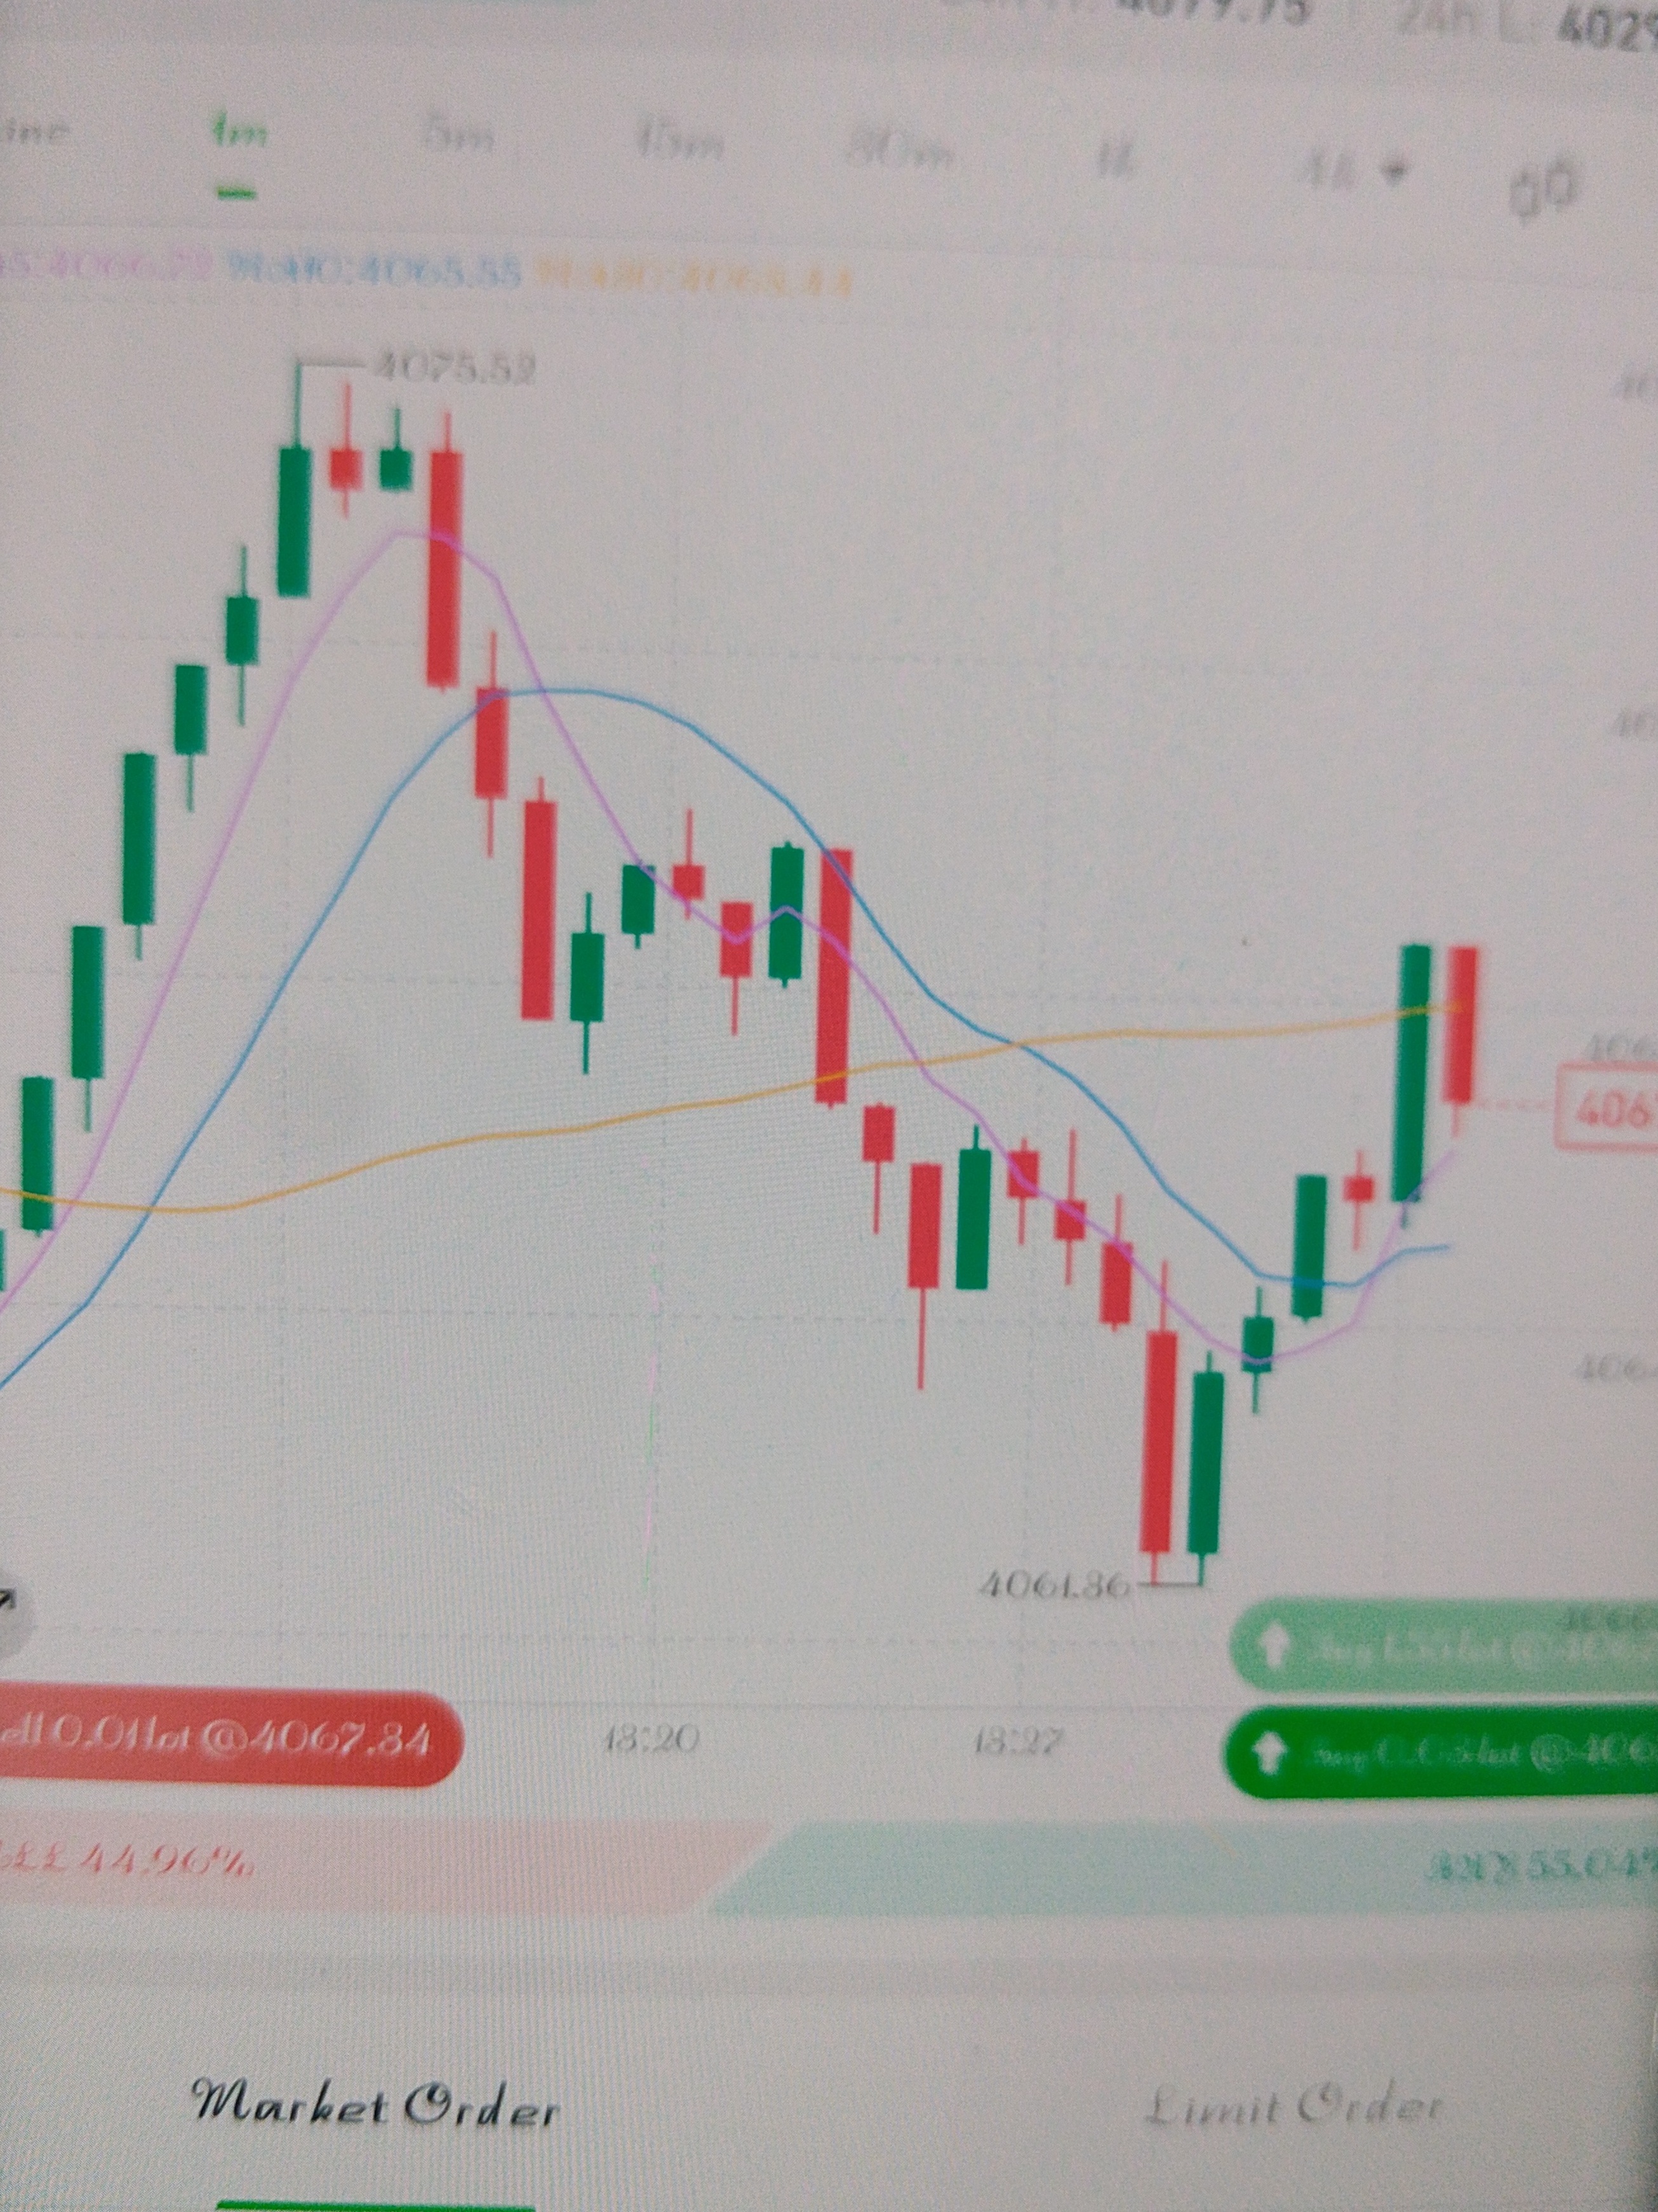
- Confidence
- 75
- Entry
- 4,066.5
- Target
- 4,075.0
- Stop
- 4,061.0
- Published
- 2026-07-02
Summary
The asset shows a strong short-term bullish reversal from a major local support level, indicating potential for continued upward momentum.
Trend
After a sharp decline from the peak of 4075.52 down to 4061.36, the price has established a strong V-shaped recovery. There is sharp buying pressure pushing the price back above the short-term moving averages.
Patterns
A swift bullish rejection and turnaround pattern formed around the 4061.36 level, characterized by high-momentum bullish engulfing candles on the 1-minute chart.
Indicators
The price has broken and closed above the immediate short-term moving averages (purple and blue lines) and is challenging the longer-term average (yellow line), signaling a potential trend shift.
Strategy
Enter long upon a successful retest or minor consolidation around 4066.50. Place a protective stop loss just below the swing low at 4061.00, targeting a recovery towards the previous high of 4075.00.
For reference only, not investment advice. Trading decisions are your own.