Samsung Electronics Buy analysis
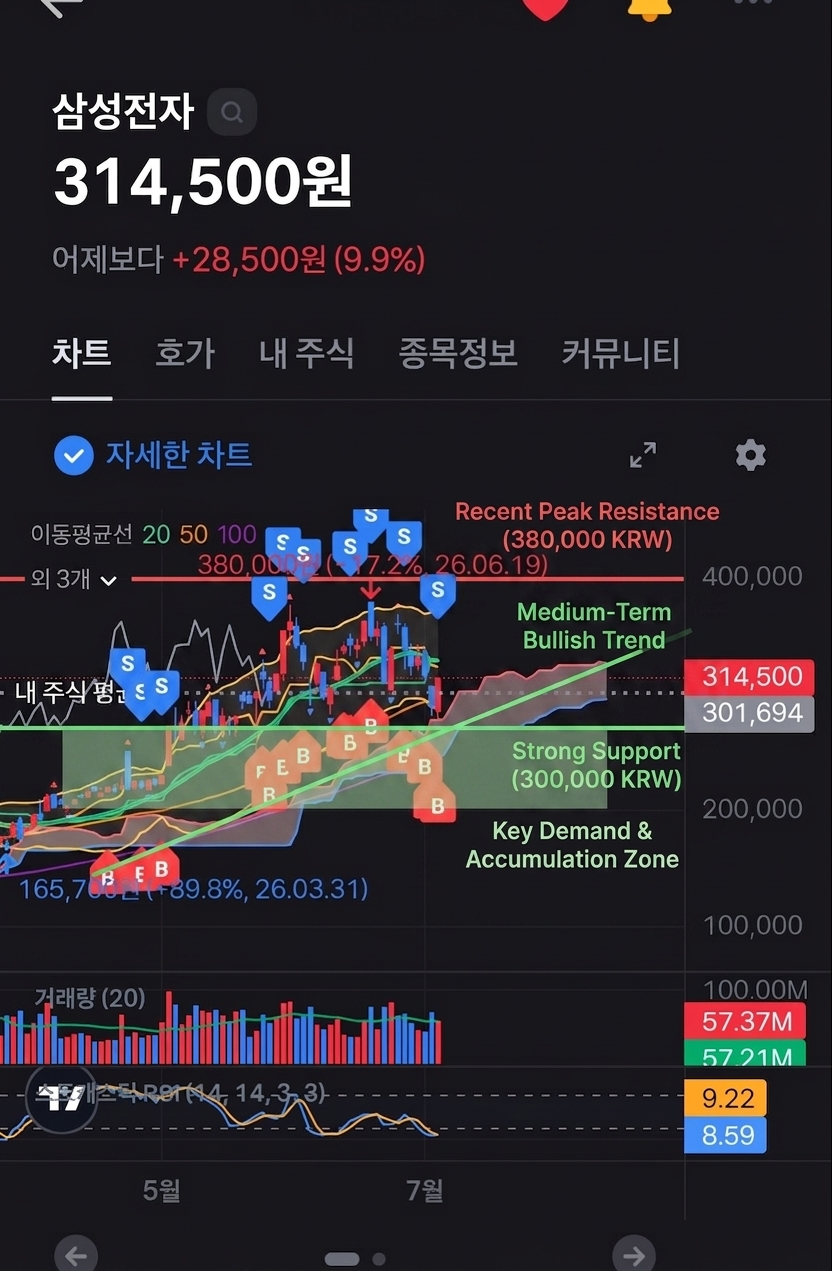
- Confidence
- 75
- Entry
- 314,500
- Target
- 380,000
- Stop
- 295,000
- Published
- 2026-07-03
Summary
Samsung Electronics shows signs of stabilizing and rebounding after finding support near the 100-day moving average and key demand zone.
Trend
The overall medium-term trend is bullish, characterized by higher highs and higher lows. Despite a recent correction from the 380,000 KRW peak, the price is holding above the significant psychological level of 300,000 KRW representing a strong structural support.
Patterns
The price action shows a series of 'B' (Buy) transaction signals cluster near the horizontal support around 300,000 KRW, indicating strong interest and potential accumulation by market participants at these levels.
Indicators
The price has closed above the 100-day moving average (purple line) and is currently at 314,500 KRW. The Stochastic RSI is in the deeply oversold territory (values around 9 and 8), signaling that the selling pressure is highly exhausted and a bullish reversal is overdue.
Strategy
Enter long near the current market price of 314,500 KRW. Place a protective stop loss just below the key structural support of 300,000 KRW. Target the major resistance level near the previous peak around 380,000 KRW.
For reference only, not investment advice. Trading decisions are your own.