GME Buy analysis
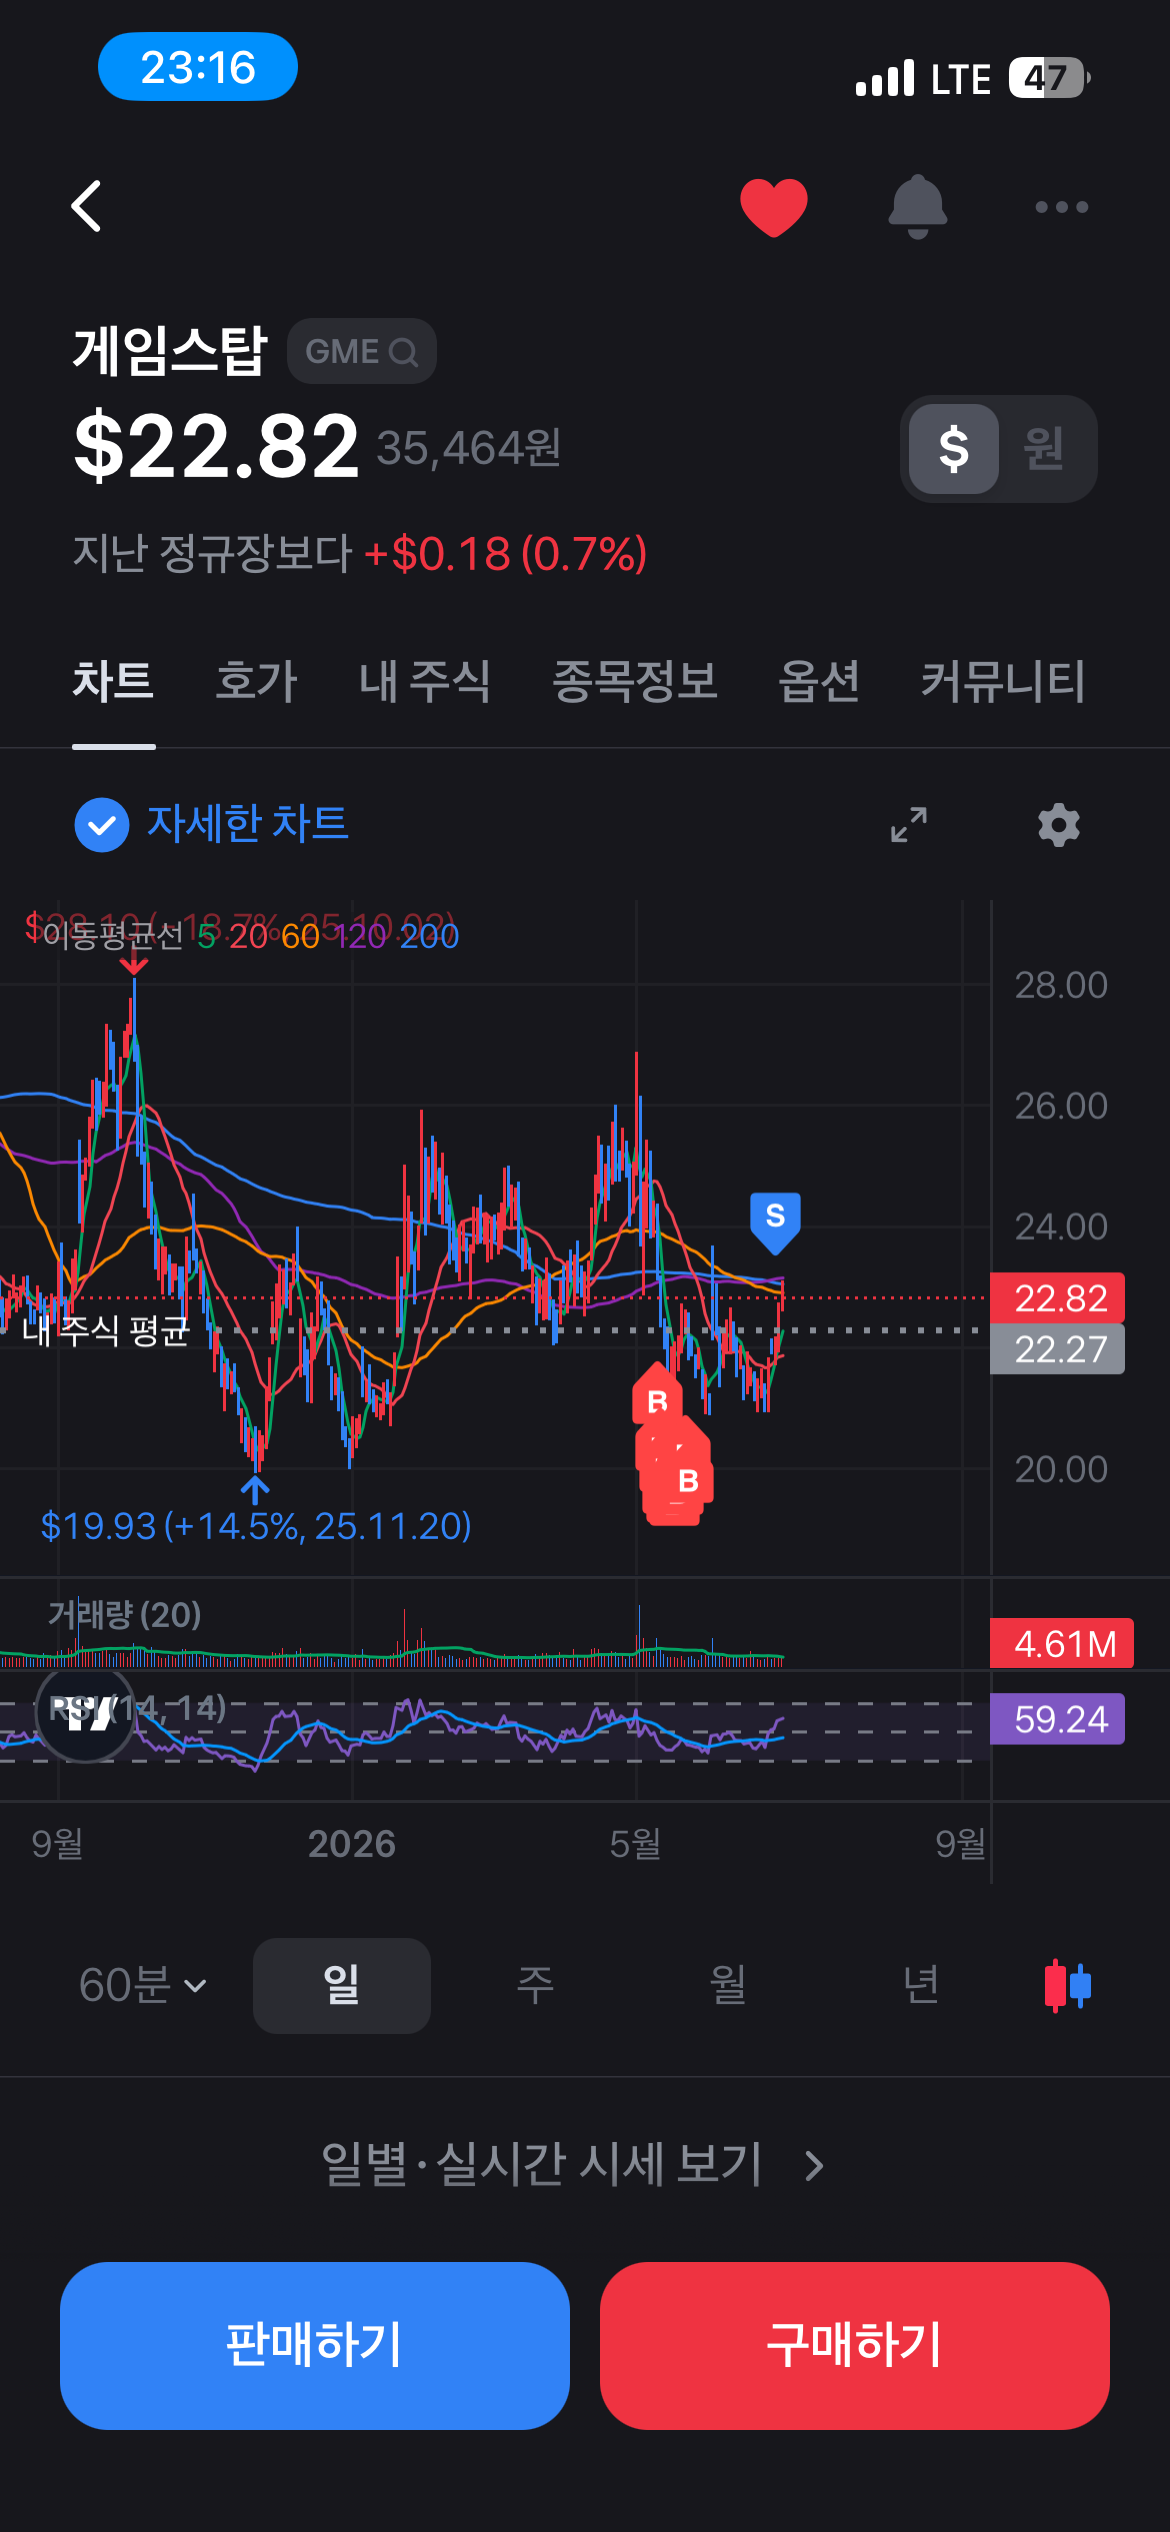
- Confidence
- 75
- Entry
- 22.82
- Target
- 27.00
- Stop
- 20.90
- Published
- 2026-07-03
Summary
GME shows bullish recovery signs from its strong key support area near $20.00, trending back above short-term moving averages.
Trend
The medium-term trend exhibits healthy consolidation after a previous surge. The price recently established a higher low above the vital $20.00 psychological support and is currently climbing back above daily moving averages.
Patterns
A clear double-bottom-like structural support has formed around $20.00 to $21.00, showing strong demand and buying pressure in this zone.
Indicators
The RSI is pointing upwards at 59.24, showing rising bullish momentum without being overbought, leaving substantial room for further upside.
Strategy
Enter long near the current level or on brief retests of the $22.27 level. Target the previous swing highs near the major resistance zone around $27.00, while securing safety below the recent bottoms.
For reference only, not investment advice. Trading decisions are your own.