WLD Buy analysis
- Confidence
- 75
- Entry
- 0.424
- Target
- 0.520
- Stop
- 0.380
- Published
- 2026-07-03
Summary
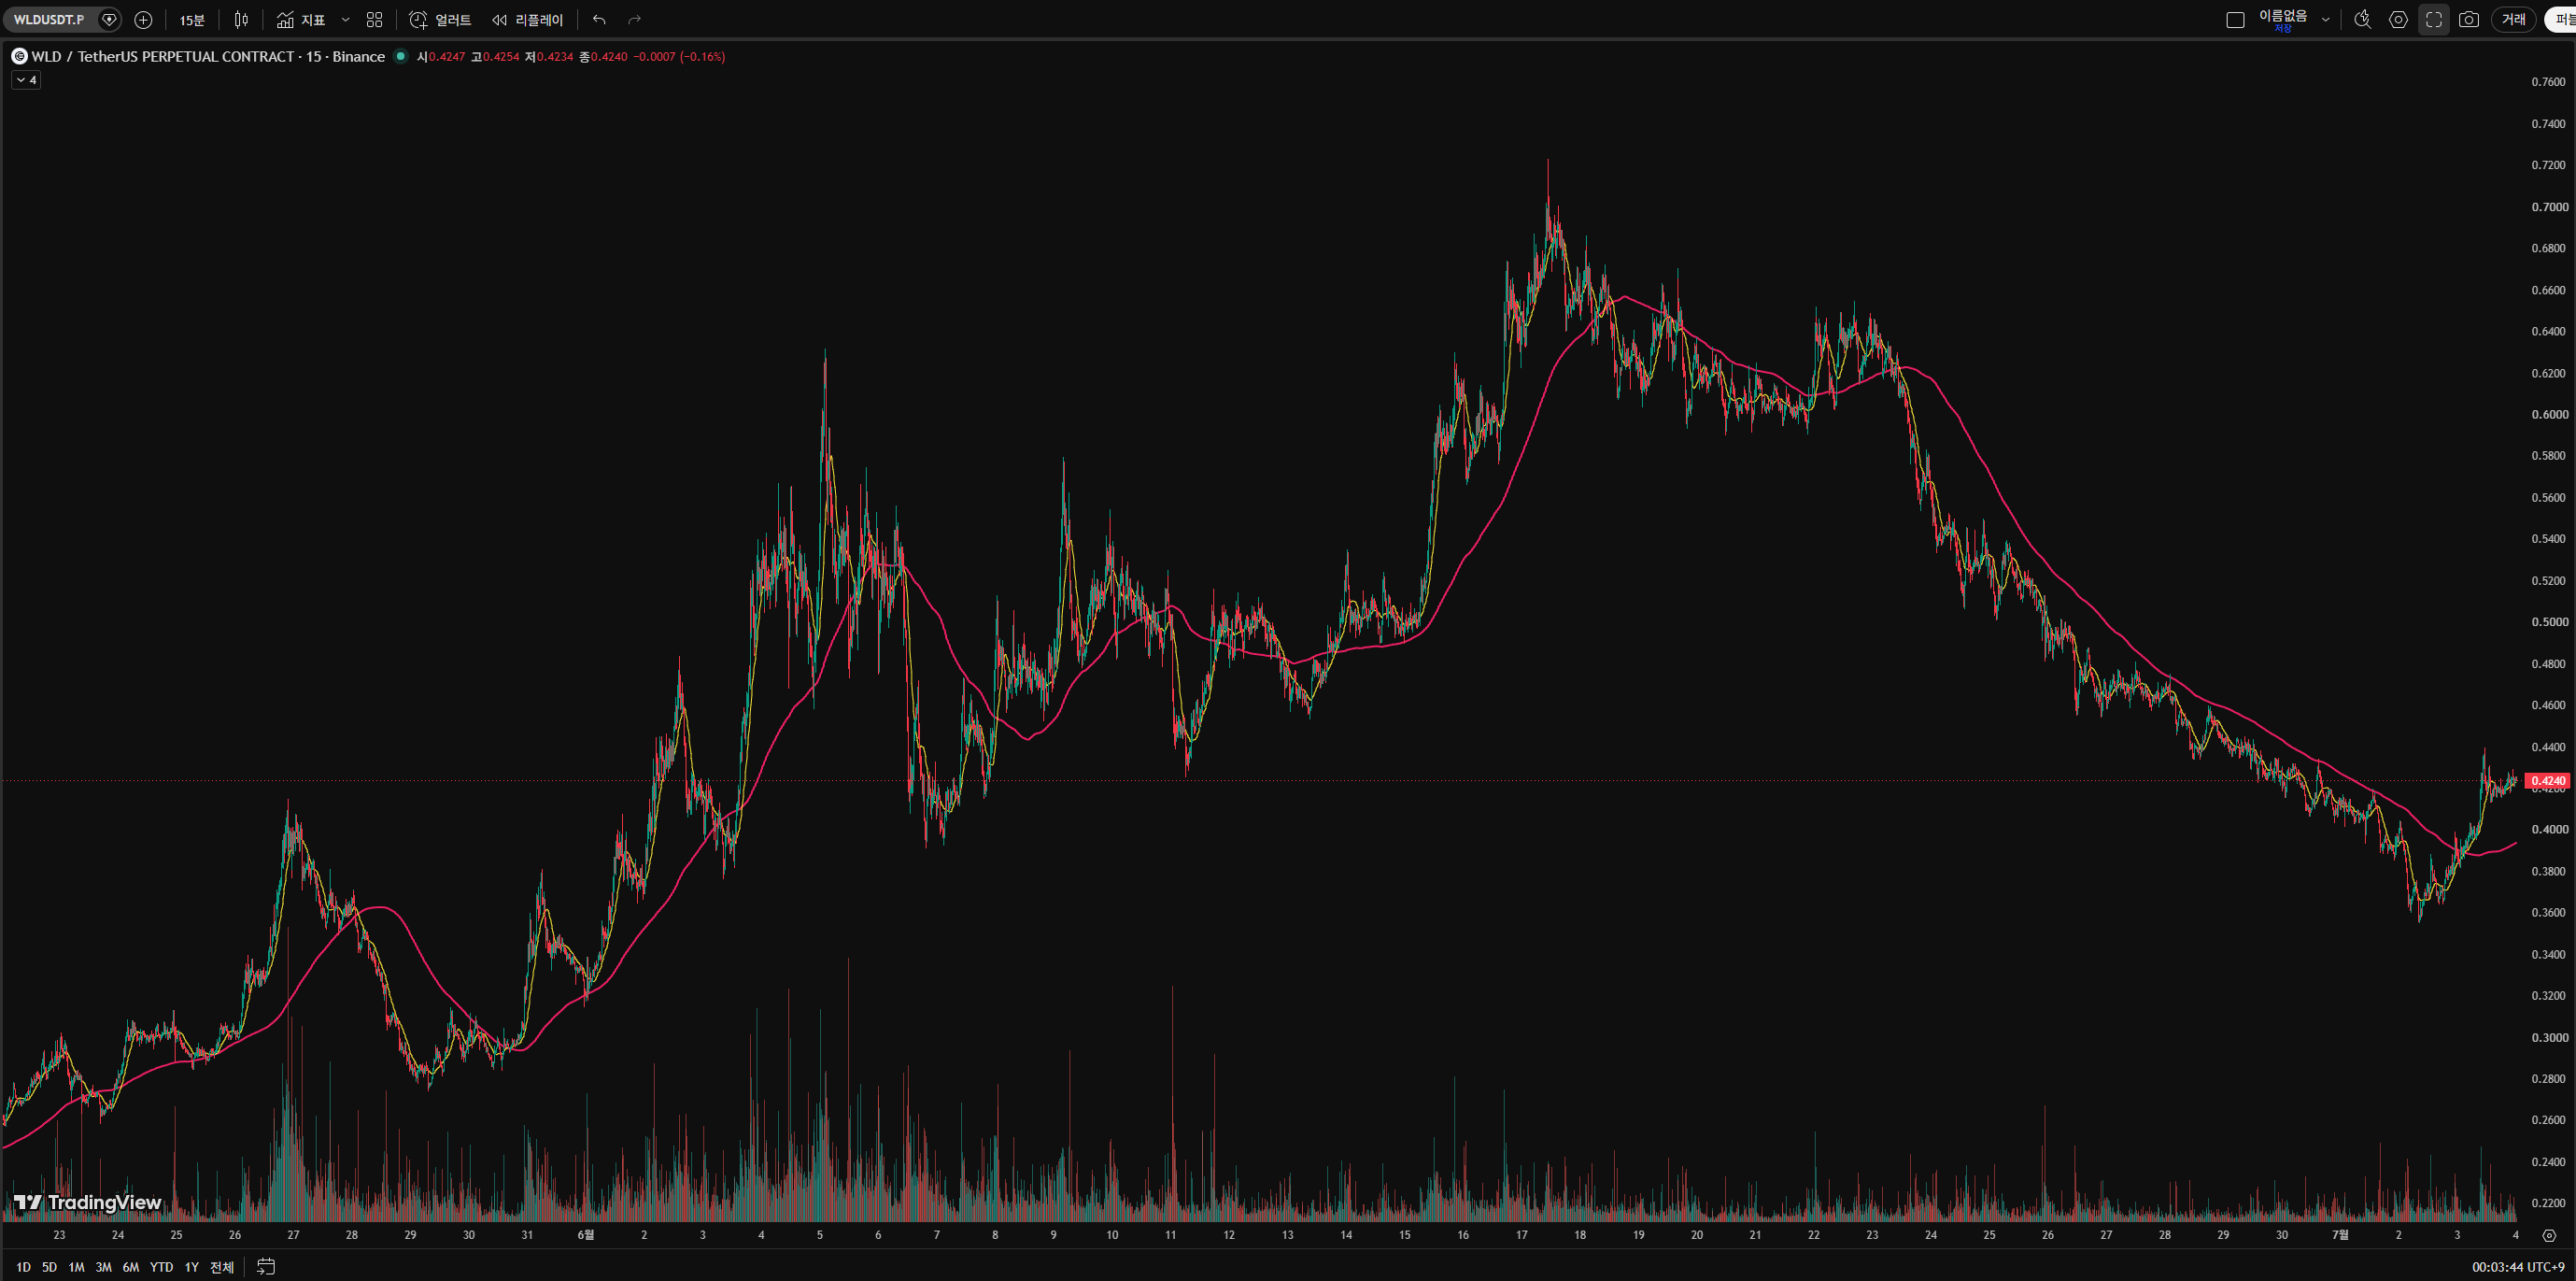
WLD shows clear signs of trend reversal after breaking above its key moving average and a long-term descending trendline.
Trend
The asset has been in a strong downtrend from its peak near 0.7200 down to 0.3600. Recently, the price has formed a local bottom, established higher lows, and crossed back above the major exponential moving average (EMA) on increasing volume, indicating a short-to-medium-term bullish reversal.
Patterns
A clear double-bottom or rounded-bottom structure has formed around the 0.3600 level, transitioning into a breakout phase above the local resistance.
Indicators
The price has convincingly broken above the dynamic resistance line (moving average) and is sustaining levels above it with rising volume spikes suggesting accumulation.
Strategy
Enter long on the current minor pullback after the breakout, placing a stop-loss below the recent swing low and targeting the next major liquidity pool and resistance area.
For reference only, not investment advice. Trading decisions are your own.