아주IB투자 Sell analysis
- Confidence
- 85
- Entry
- 4,550
- Target
- 2,500
- Stop
- 6,100
- Published
- 2026-07-04
Summary
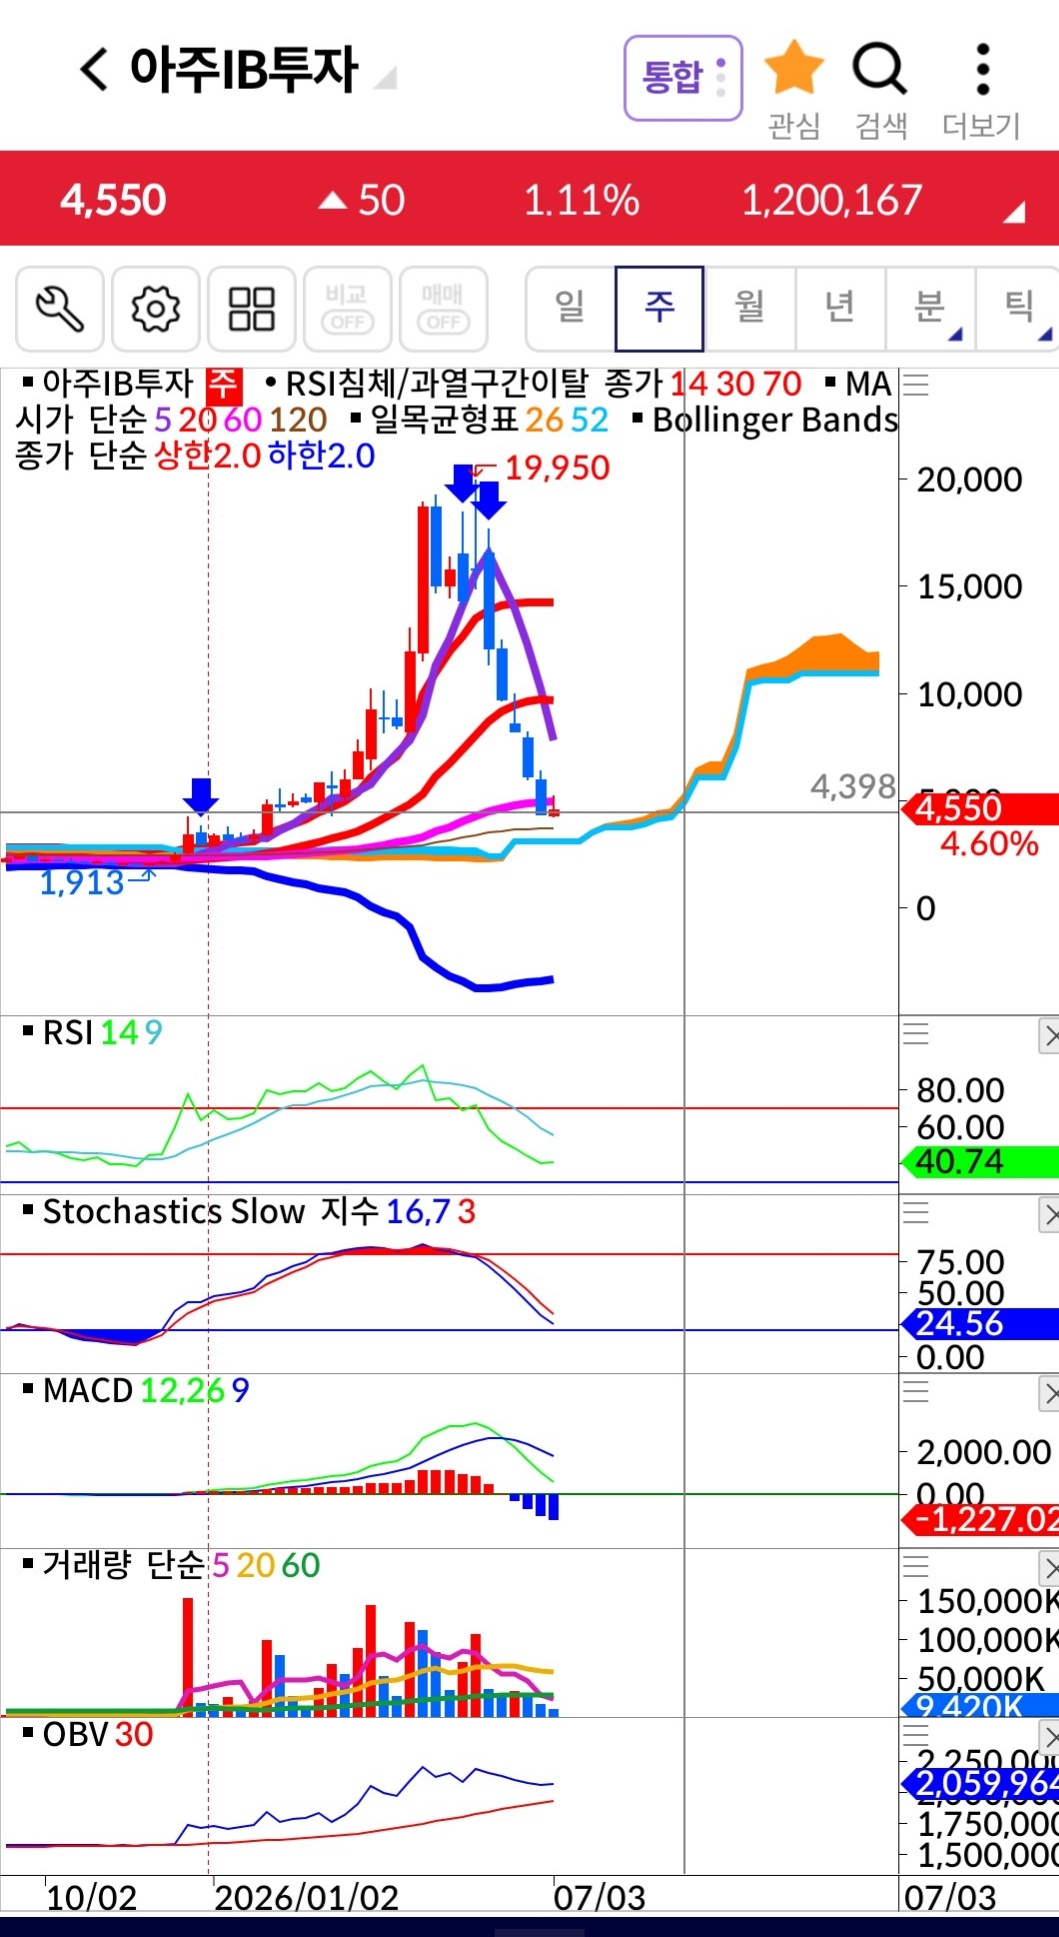
The asset is in a strong medium-term downtrend after peaking near 20,000, with multiple technical indicators showing sustained bearish momentum.
Trend
The price has broken aggressively below its short and medium-term moving averages (5, 20, and 60 MAs). The long-term moving average (120 MA) is currently being tested as support, but the overall trajectory is sharply downward.
Patterns
After a massive parabolic rally to approximately 19,950, a sharp 'head and shoulders' style distribution pattern has formed. The subsequent breakdown represents a structural regime shift from bullish to bearish.
Indicators
The RSI is declining toward oversold territory (40.74) without showing signs of divergence. The Stochastics Slow indicator is pointing downward at 24.56, suggesting further room to fall. MACD shows a strong bearish crossover with widening negative histograms (-1,227.02).
Strategy
Sell current rallies or short on any brief pullbacks. Immediate targets lie near the next major historical support area, while stop losses should be placed above the nearest minor swing high.
For reference only, not investment advice. Trading decisions are your own.