WLD Buy analysis
- Confidence
- 75
- Entry
- 0.425
- Target
- 0.520
- Stop
- 0.380
- Published
- 2026-07-04
Summary
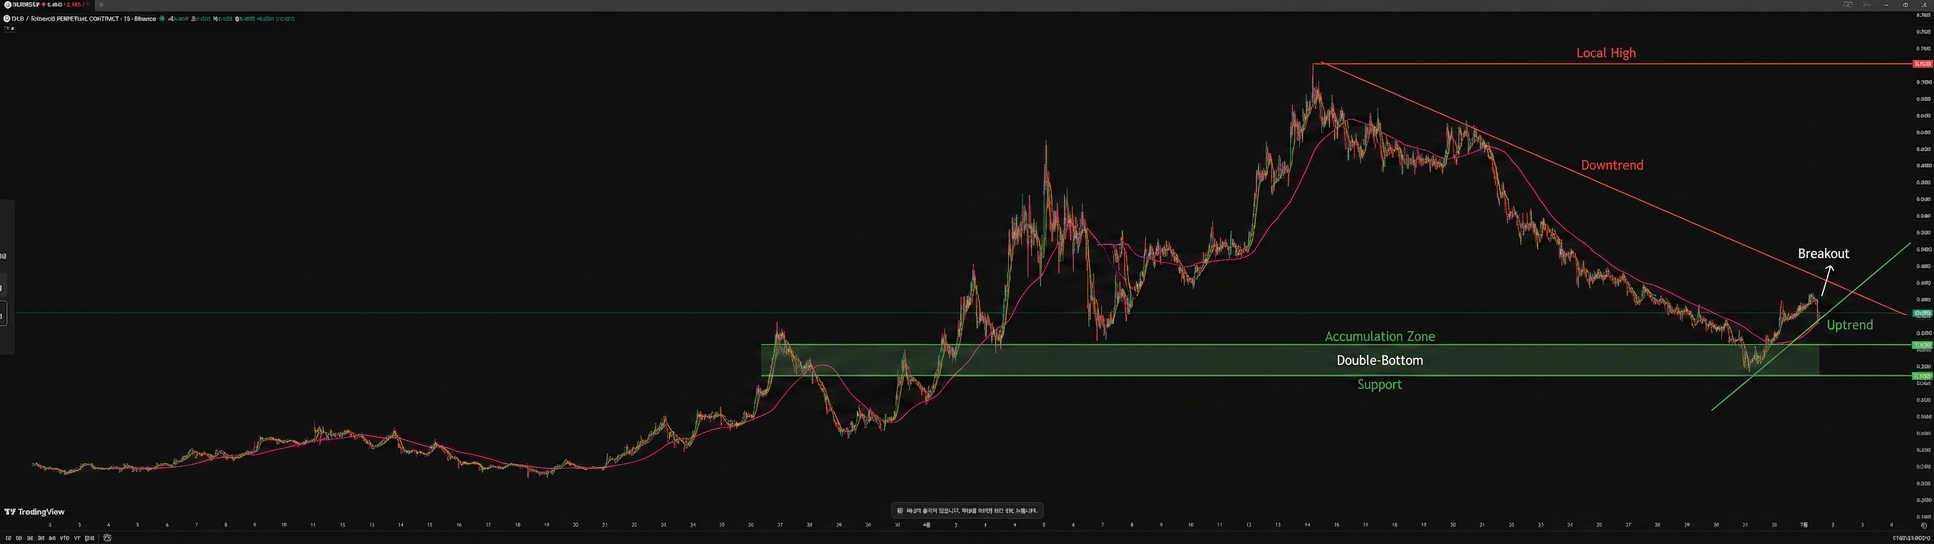
The price is showing signs of a trend reversal as it breaks above its moving average on the 15-minute chart following a prolonged downtrend.
Trend
After a steep downtrend from the local high near 0.7200 down to support around 0.3400, the price has stabilized and is beginning to form higher lows. Price has successfully crossed over and is holding above its EMA line, indicating a near-term bullish shift.
Patterns
A clear double-bottom type structure has formed around the 0.3400-0.3600 accumulation zone, followed by an impulsive leg up and a breakthrough above immediate resistance.
Indicators
The price action is trading above the red Moving Average line, which is flattening and starting to slope positive, suggesting a shift in momentum from bearish to bullish.
Strategy
Enter long on the current breakout above the moving average, placing a tight invalidation stop-loss below the recent swing low and targeting the next major resistance levels on the way up.
For reference only, not investment advice. Trading decisions are your own.