Chart Sell analysis
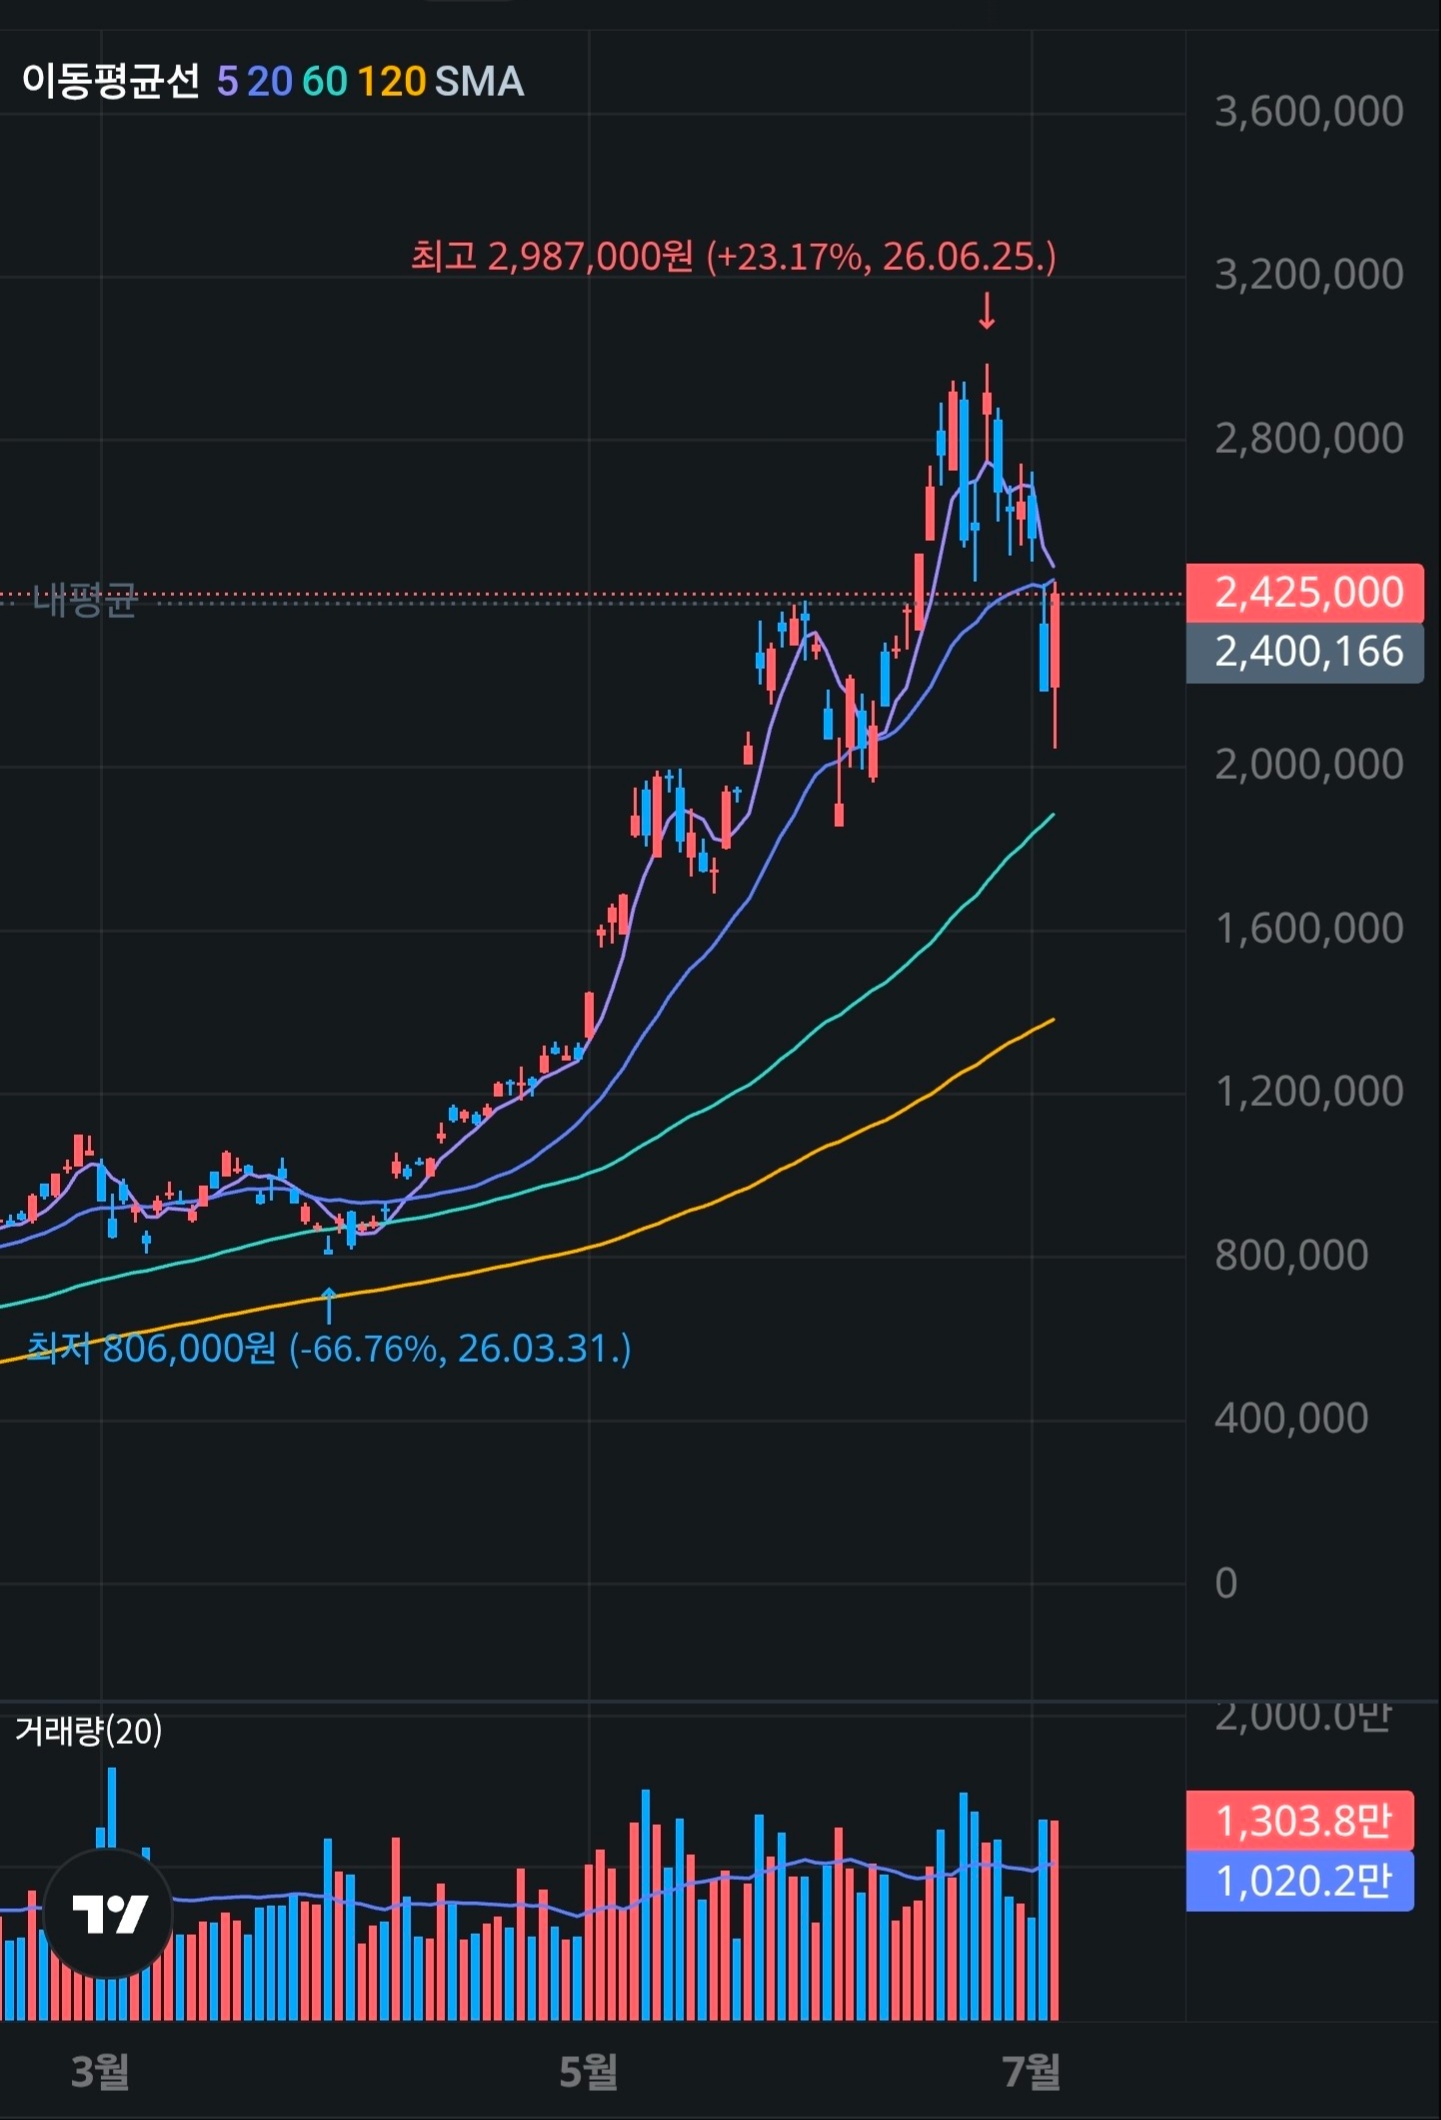
- Confidence
- 75
- Entry
- 2,380,000
- Target
- 2,000,000
- Stop
- 2,550,000
- Published
- 2026-07-04
Summary
The asset has experienced a sharp technical breakdown below its short-to-medium-term moving averages with increasing bearish momentum.
Trend
While the long-term trend remains upward, the short-term trend has aggressively reversed. The price has sharply broken below the 5, 20, and 60 SMAs in a single large bearish candle, signaling a highly dominant seller presence.
Patterns
The price has formed a double top-like structure near the peak of 2,987,000 KRW and failed to maintain higher ground, prompting a swift decline that broke the prior swing support.
Indicators
The price has crashed below the 20-period and 60-period Simple Moving Averages (SMA) on notable volume, indicating that dynamic support has failed.
Strategy
Engage in a short position or exit existing longs on a minor pullback towards the broken support level, targeting the next significant moving average support.
For reference only, not investment advice. Trading decisions are your own.