EUR/USD Buy analysis
- Confidence
- 70
- Entry
- 1.14286
- Target
- 1.14310
- Stop
- 1.14270
- Published
- 2026-07-07
Summary
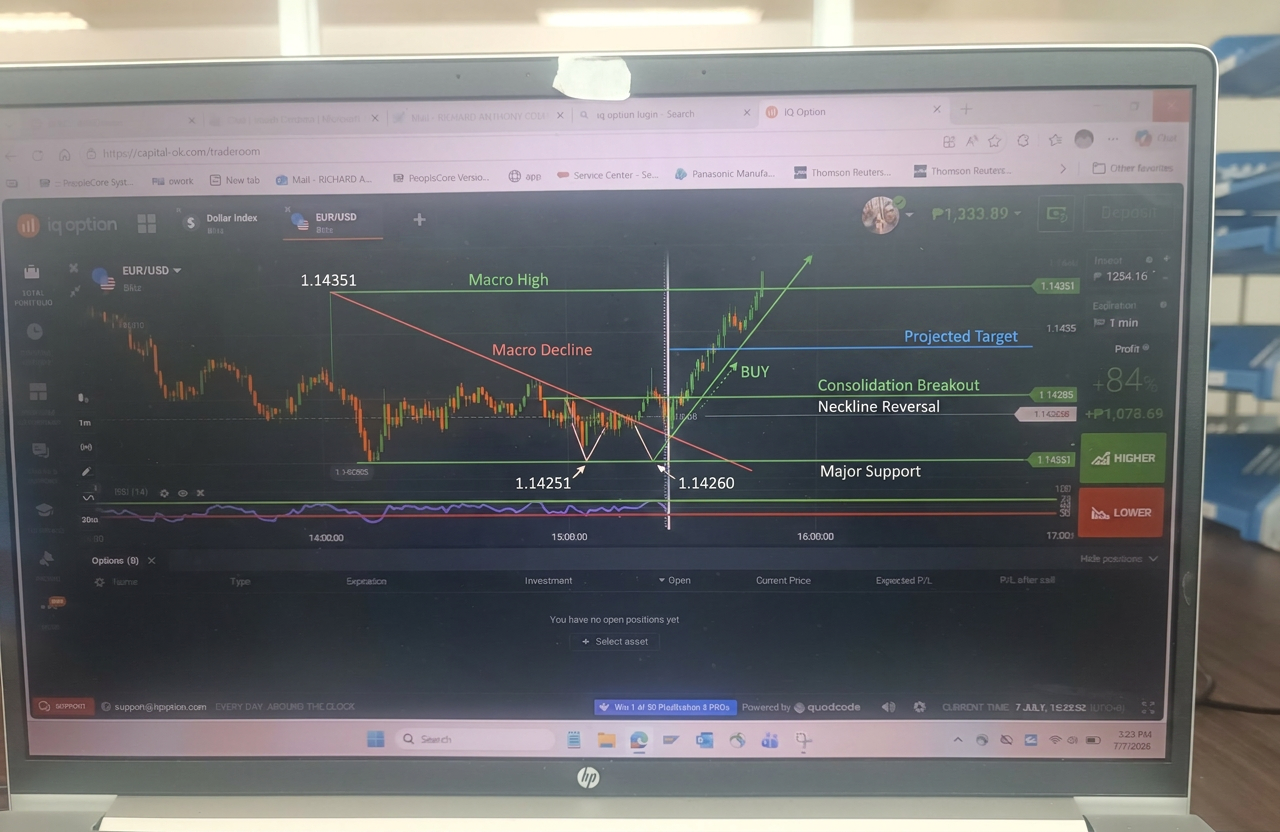
The EUR/USD chart on the 1-minute interval shows a clear short-term trend reversal and breakout above a prior consolidation zone. This localized strength suggests immediate bullish momentum, making a HIGHER (BUY) option favorable for binary options trading.
Trend
The overall context reveals a macro decline from the high of approximately 1.14351 down to a major support level near 1.14251, marking a minor correction. Following this sell-off, a prolonged period of consolidation materialized between 14:00 and 15:00. Recently, the price has broken out above the upper limit of this range (around 1.14285) with a series of consecutive green candles. This breakout indicates shift in short-term control from sellers to buyers.
Patterns
A clear double-bottom reversal structure formed between the major low of 1.14251 and a secondary test near 1.14260. The breakout above the neckline of this structure at approximately 1.14280 confirms the bullish reversal pattern. Currently, the candlestick pattern shows a series of strong bullish candles approaching the local resistances. This structure points toward a projected measured target near the 1.14320 level.
Indicators
The RSI (14) indicator is visible at the bottom of the chart pane. It is currently hovering around the 55 to 60 level, indicating a steady rise in bullish momentum without being overextended into overbought territory (above 70). No moving averages or MACD are displayed on this specific layout. The clear upward slope of the RSI line supports the price action breakout, confirming the validity of the move.
Strategy
Given that this is a 1-minute binary options setup (IQ Option platform), the trade requires an execution on the 'HIGHER' button with a short-term expiration. The entry is triggered near the current market price of 1.14286 following the breakout of the consolidation box. The stop loss represented here is the invalidation level directly below the local breakout point. The target level is set towards the next minor resistance level overhead.
For reference only, not investment advice. Trading decisions are your own.