EUR/USD Buy analysis
- Confidence
- 70
- Entry
- 1.14268
- Target
- 1.14310
- Stop
- 1.14255
- Published
- 2026-07-07
Summary
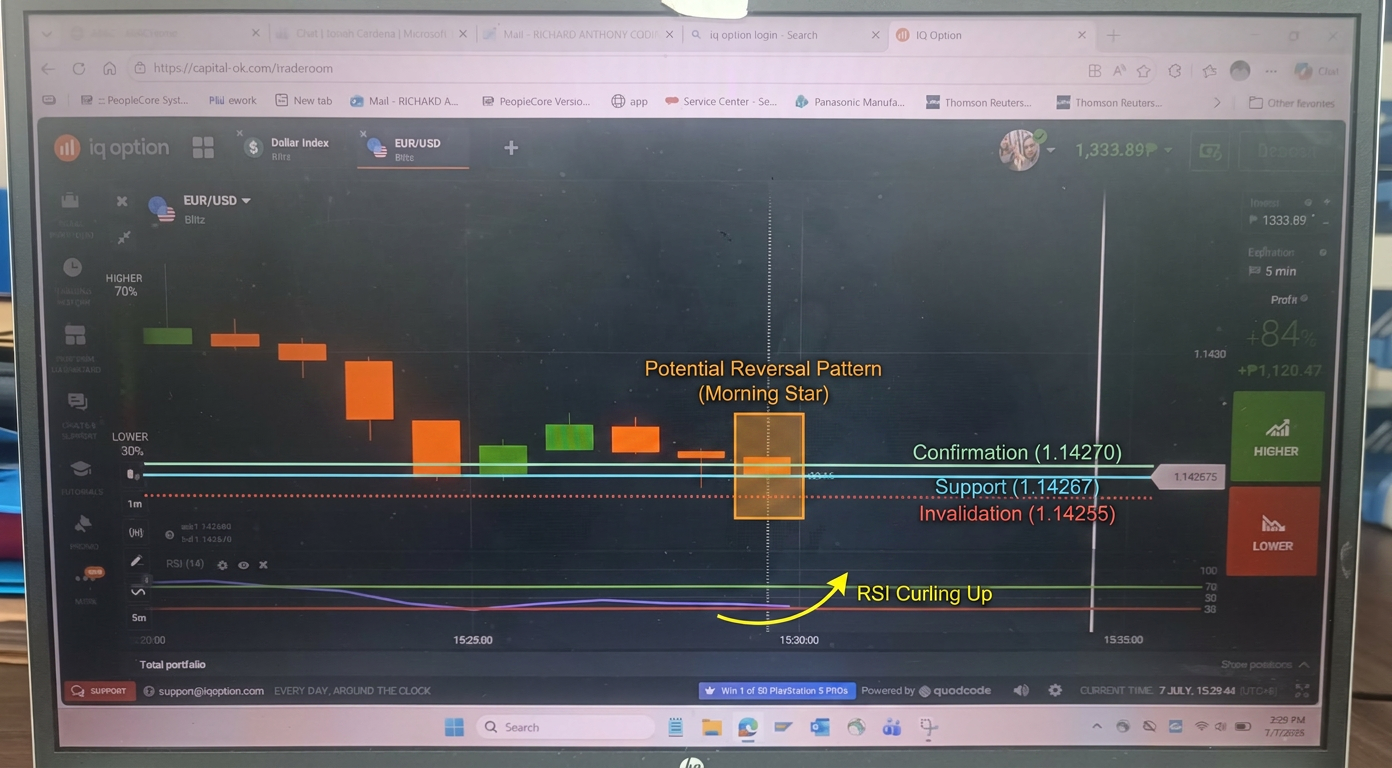
The EUR/USD asset is showing signs of stabilizing at a horizontal support level marked by the recent swing lows near 1.14267. The RSI indicator is bottoming out near its lower boundaries and beginning to curl upwards, suggesting that the bearish momentum is exhausting and a short-term bullish retracement or bounce is highly probable.
Trend
The short-term trend on this 1-minute chart has been heavily bearish, moving down from the levels above 1.1430 to currently trade near 1.14267. However, the downward movement has decelerated significantly over the last several candles, transitioning into a sideways consolidation pattern. There are no standard major moving averages displayed on this chart, but the price action relative to the horizontal support indicates the primary bearish impulse is losing strength. A break and close below the recent low of 1.14255 would invalidate this potential bullish reversal setup.
Patterns
A series of large bearish candles previously pushed the price lower, but the last several candles are characterized by smaller bodies and prominent lower wicks. This candlestick geometry reveals buying pressure emerging at lower levels. Specifically, the second-to-last candle is a small Doji-like bar, followed by a stabilizing candle, which together suggest a potential morning star or bullish reversal pattern is attempting to form at this established floor. A successful close of a bullish candle above the current 1.14270 level would confirm this short-term reversal.
Indicators
The RSI (14) indicator is displayed at the bottom of the chart. It recently dipped towards the oversold region near the 30 line during the sharpest part of the decline but has since leveled off and started a mild upward curvature (curling toward the 40-50 area). This bullish divergence/stabilization in the RSI indicates that the downside momentum is slowing down rapidly. Other indicators like moving averages or MACD are not present on this screen.
Strategy
With the price stabilizing at a key horizontal level of 1.142675, a long scenario/BUY option is preferred. The strategy is to enter a 'Higher' option or long position at the current market level of approximately 1.142675. Risk can be strictly defined by placing a stop-loss just below the session low at 1.14255. The target for this short-term bounce should be the previous consolidation zone or minor resistance located near 1.14310.
For reference only, not investment advice. Trading decisions are your own.