EURUSD Sell analysis
- Confidence
- 75
- Entry
- 1.14285
- Target
- 1.14260
- Stop
- 1.14310
- Published
- 2026-07-07
Summary
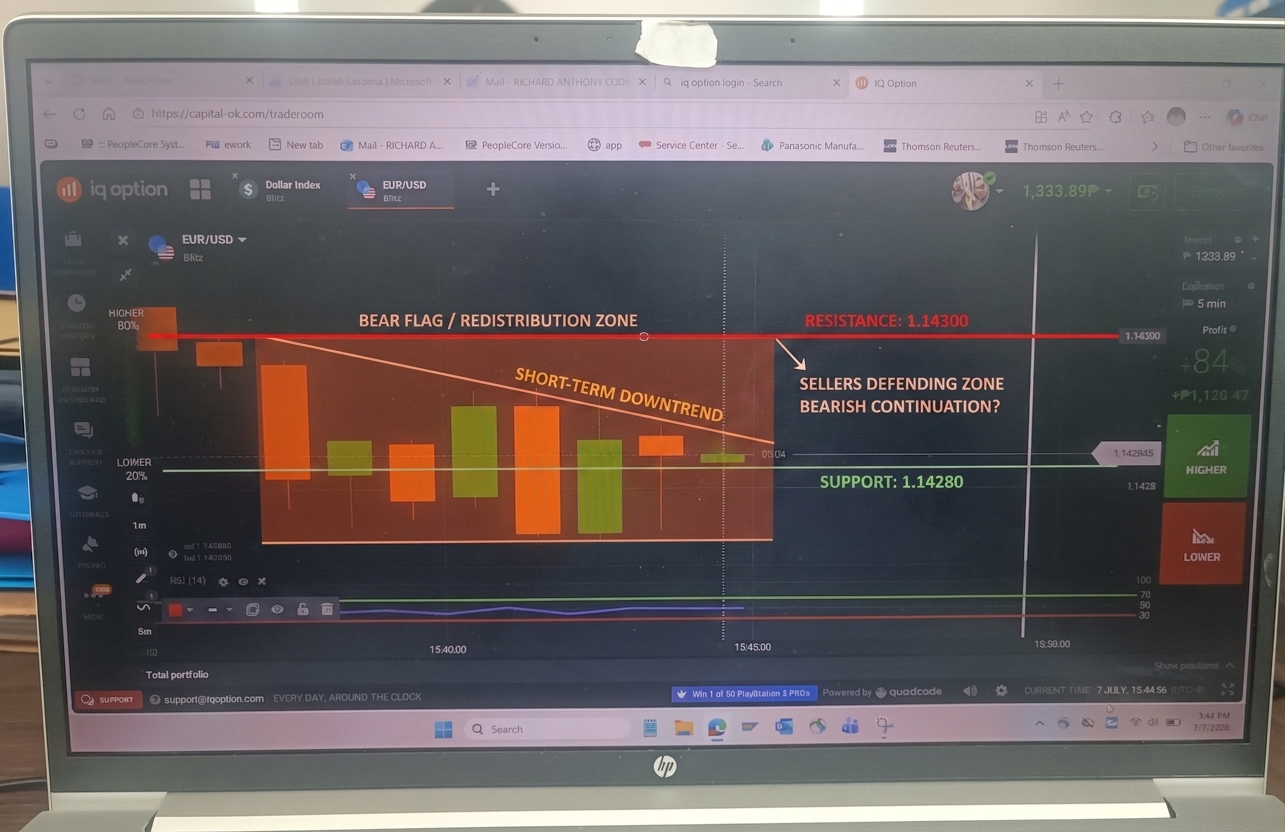
The EUR/USD chart exhibits a short-term bearish bias as price action remains below the key horizontal resistance line at 1.14300, following a major sell-off. The current consolidation has failed to break back above this major horizontal barrier, hinting at a continuation lower.
Trend
The short-term trend is clearly downward as marked by the massive red bearish candles initiating the sequence, taking the price from above 1.14300 down to a low near 1.14280. Moving averages are not explicitly plotted on this chart, but the price-to-action structure shows the market making lower highs and struggling to reclaim the break level. The trend will only be invalidated and turn bullish if the asset manages to breach and close above the resistance line of 1.14300, which has currently rejected multiple small green candles.
Patterns
A clear redistribution or consolidation pattern is forming underneath the horizontal resistance level of 1.14300. The initial sharp drop created a strong bearish candlestick pattern, and the subsequent alternating green and orange candles represent a weak, low-volume retracement. The failure to sustain any move above 1.14300 indicates that sellers are defending this zone heavily, which historically points to a bearish continuation pattern like a bear flag.
Indicators
The RSI (14) is visible at the bottom of the chart and is currently hovering around the 35 level, which is in the lower bearish control zone but not yet oversold. This low RSI value confirms strong negative momentum and implies there is still plenty of room to the downside before technical exhaustion occurs. Other indicators such as MACD or Bollinger Bands are not in use on this setup, but volume looks relatively flat during this consolidation, signaling lack of buying interest.
Strategy
The primary strategy is to trade a continuation of the downtrend (LOWER option in binary terms, or a short spot position). Enter a short trade near the current price level below the key resistance. Keep a strict stop loss just above the major horizontal level of 1.14300 to limit risk against a false breakdown recovery. Take profits should be set at the next structural support zone near 1.14260.
For reference only, not investment advice. Trading decisions are your own.