GBPNZD Sell analysis
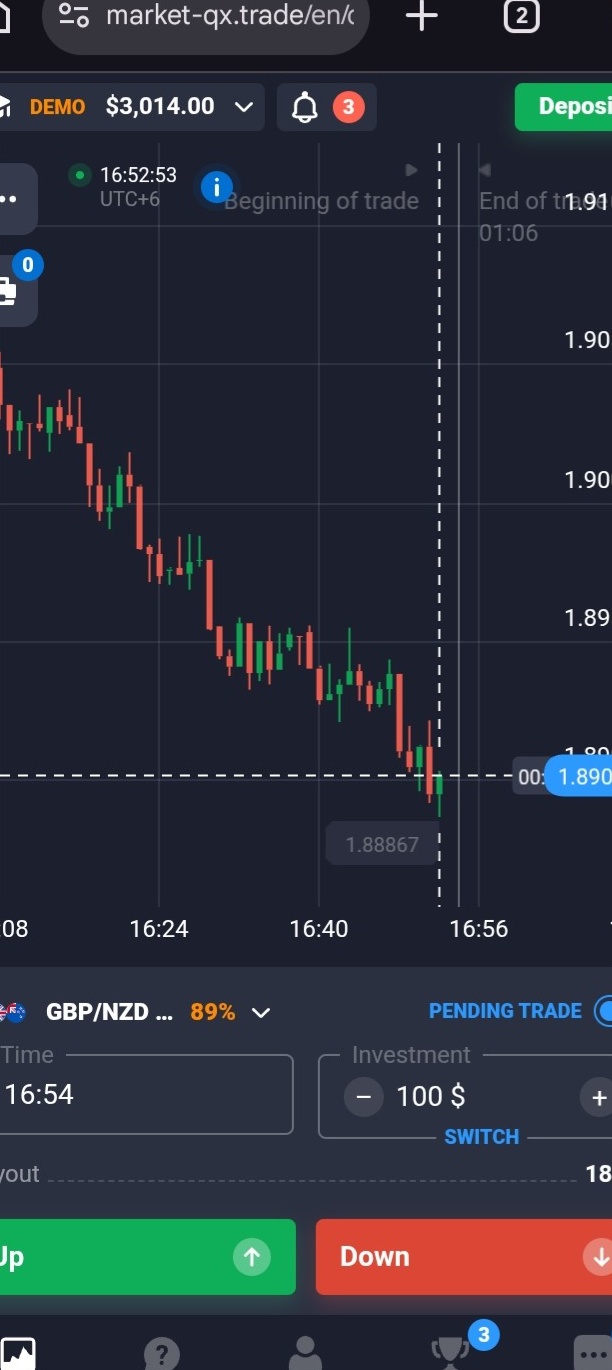
- Confidence
- 75
- Entry
- 1.890
- Target
- 1.885
- Stop
- 1.893
- Published
- 2026-07-07
Summary
The asset is exhibiting a highly persistent and structured downtrend, characterized by sequential lower highs and lower lows. The immediate price action shows a failed attempt to recover near the key psych-level, indicating dominant selling pressure that warrants a continuation play to the downside.
Trend
The intraday trend is strongly bearish throughout the visible timeline from 16:08 onward. The market has consistently depreciated from above the 1.90000 range down to a recent bottom of approximately 1.88867. There are no moving averages visible on this chart interface, but the price-action distribution clearly indicates strong bearish momentum. The downward trend would only be invalidated if the market could break and sustain a price action structure above the previous consolidation lower-high established around 1.89400.
Patterns
Several bearish continuation candle clusters are visible, specifically the persistent red blocks leading into the bottoming tail near 1.88867. Though the final candle shows a minor green upward push, the overarching pattern represents a classic cascading channel markdown. There are no double bottoms or bullish reversal patterns established yet to indicate the sell-off has concluded.
Indicators
Aside from the candlesticks indicating volume flow and price direction, standard technical indicators such as the RSI, MACD, or Bollinger Bands are not shown on this clean chart interface. However, the horizontal price guide markers indicate a strong break below the 1.89000 level, which has now transitioned from a previous psychological support into an active overhead resistance area.
Strategy
The suggested strategy is to short the asset or place a 'Down' trade on the platform upon minor pullbacks near the 1.89000 level. We look to capitalize on the continuation of the broader structural bearish trend targeting the next logical psychological extensions down. A defensive stop loss must be placed tightly above the short-term resistance structure at 1.89300 to manage risk on any unexpected reversal.
For reference only, not investment advice. Trading decisions are your own.