QQQ Sell analysis
- Confidence
- 75
- Entry
- 711
- Target
- 660
- Stop
- 740
- Published
- 2026-07-09
Summary
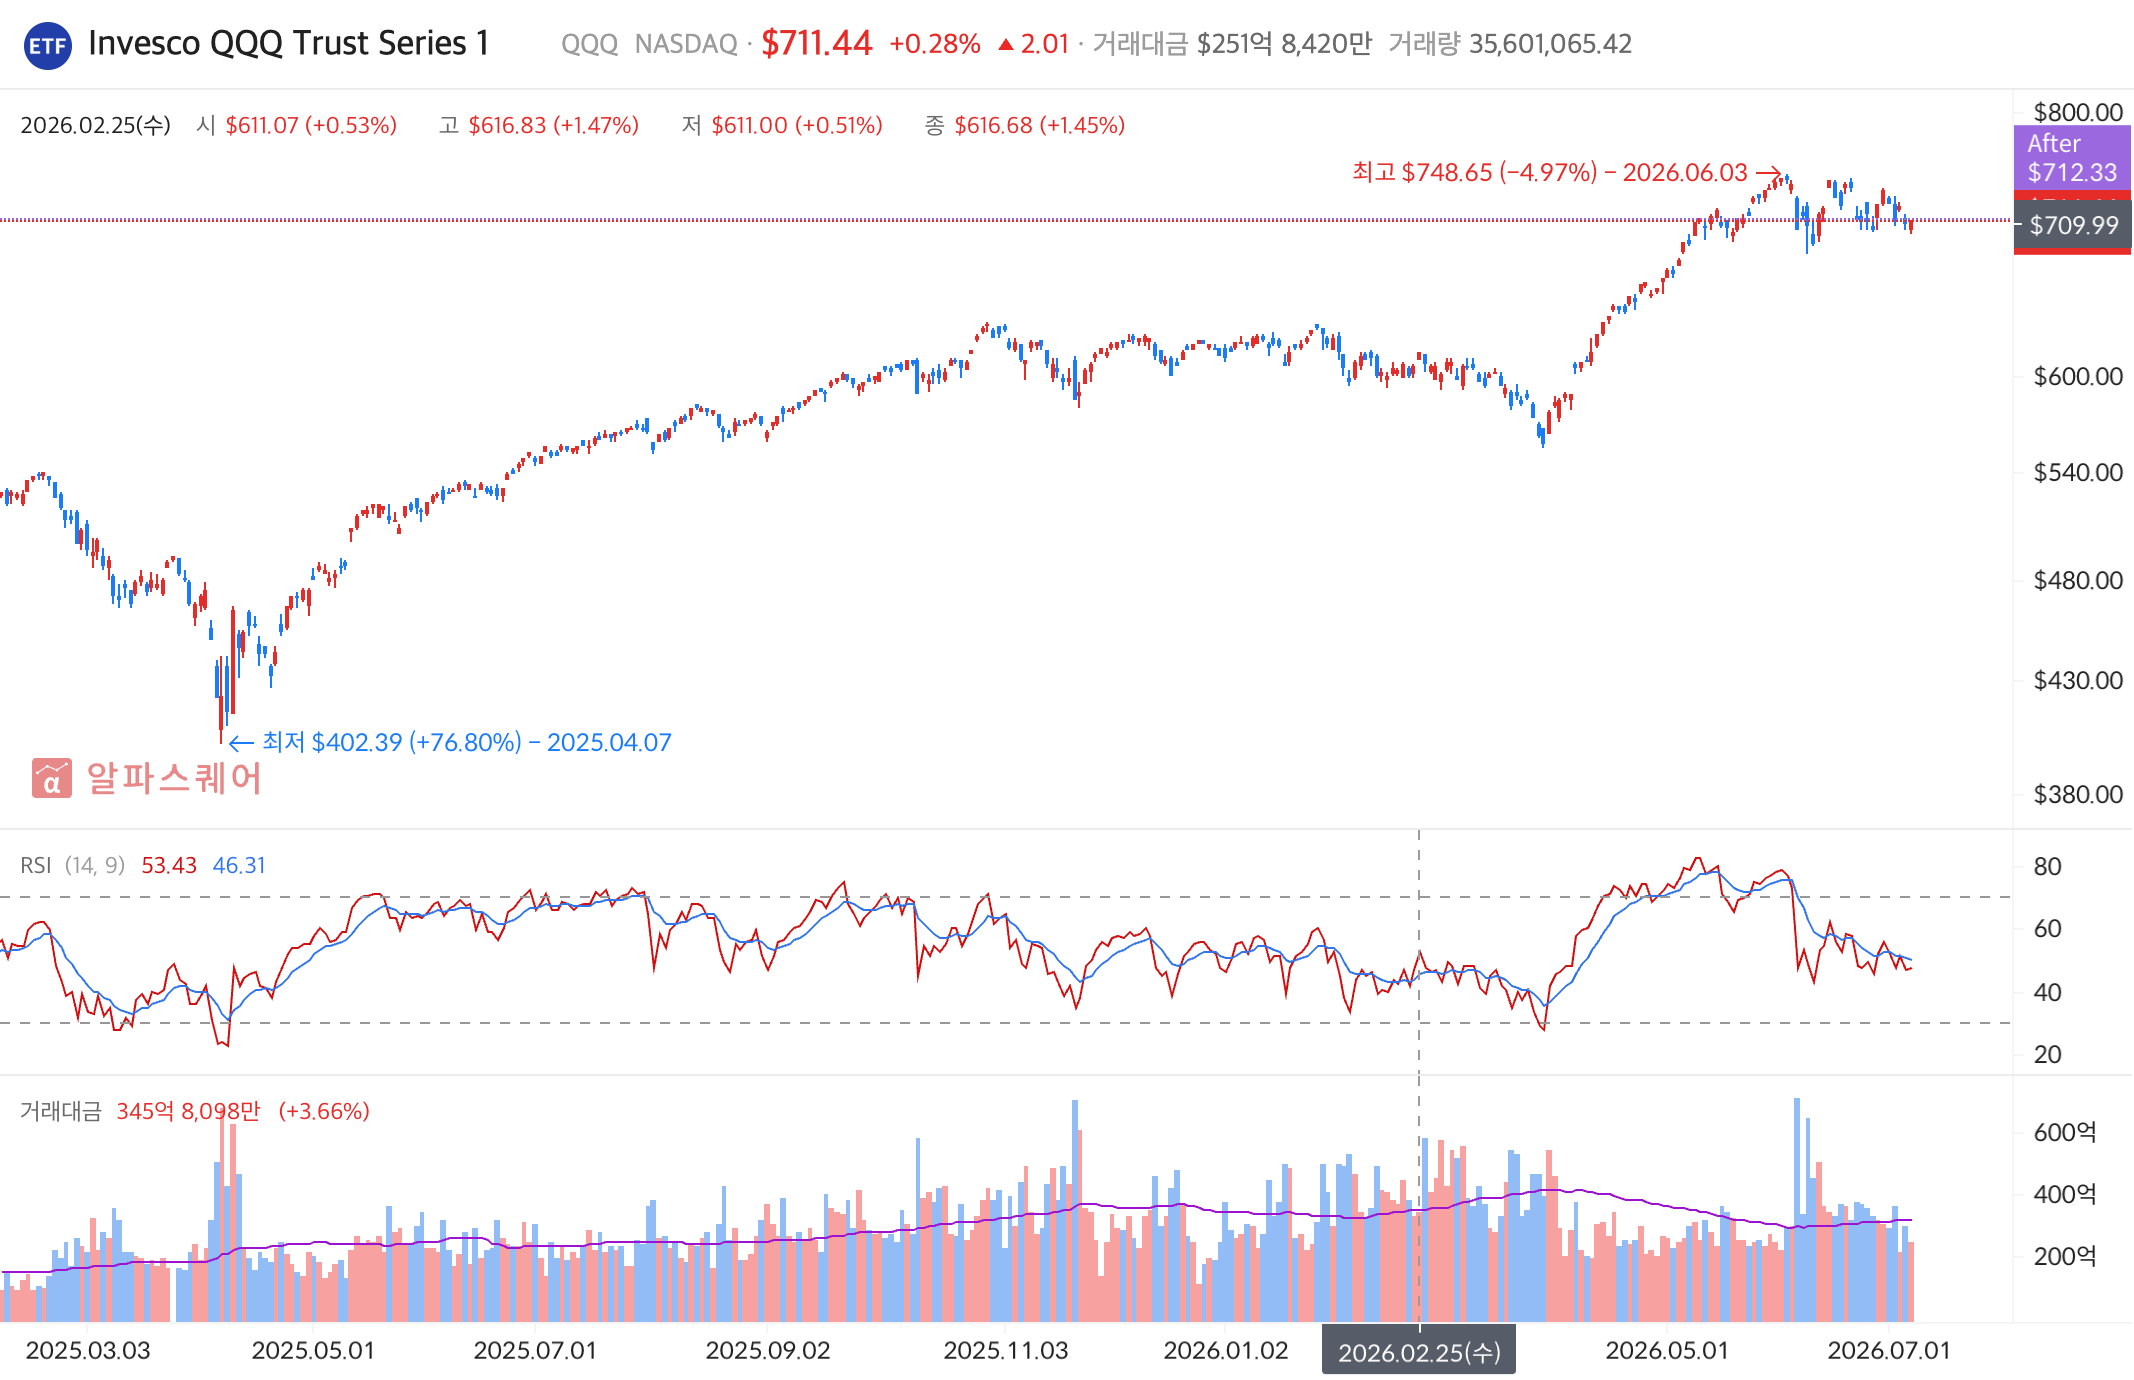
The Invesco QQQ Trust ETF is showing signs of a near-term trend reversal and exhaustion near structural resistance. After a long-term bull run, the price recently established a peak at 748.65 on 2026.06.03 and is now forming a double top/distribution pattern with declining bearish momentum, indicating a high probability of a corrective phase down to major structural support.
Trend
The long-term primary trend was strongly bullish, recovering from a major low of 402.39 on 2025.04.07 to a recent high of 748.65, representing an increase of approximately 86%. However, the medium-term trend is turning bearish as the price has started making lower highs and lower lows over the past month. Moving averages are not explicitly plotted as lines over the price action on this chart, but the price is drifting below its recent local consolidation levels, indicating a loss of upward momentum. A clean break below the key local support of 700.00 will confirm that the short-to-medium-term trend has officially invalidated the previous bullish structure.
Patterns
A clear double-top/distribution pattern is forming at the very top of the chart near the 740.00 to 748.65 price zone. The first peak occurred at 748.65 in early June 2026, followed by a minor pullback and another failed attempt to break higher, establishing a lower peak. This structure strongly suggests that buyers are exhausted and institutional distribution is taking place. The pattern will be fully confirmed upon a decisive daily close below the neckline/support zone of approximately 700.00, which would target a deeper correction.
Indicators
The RSI (14, 9) is currently hovering at 53.43, which is neutral but declining from previously overbought levels peak near 80 in May 2026. This significant bearish divergence—where price made equivalent or slightly higher highs while the RSI made vastly lower highs—signals a severe loss of underlying buying momentum. Volume indicators at the bottom show that while the volume remains relatively steady around the average line, the recent red downward volume bars are dominant, reinforcing the distribution thesis. Other typical indicators like MACD or Bollinger Bands are not displayed on this chart.
Strategy
The optimal strategy is to enter a short position (or trim existing long exposure) near current levels of 711.44 or on a brief corrective bounce toward 720.00. The stop-loss should be placed just above the recent local structural swing high at 740.00, limiting risk on this trade. The primary target for taking profit is the major psychological and structural support level around 660.00, where previous consolidation and buying interest occurred.
For reference only, not investment advice. Trading decisions are your own.