EURUSD Buy analysis
- Confidence
- 75
- Entry
- 0.98235
- Target
- 0.98450
- Stop
- 0.98050
- Published
- 2026-07-16
Summary
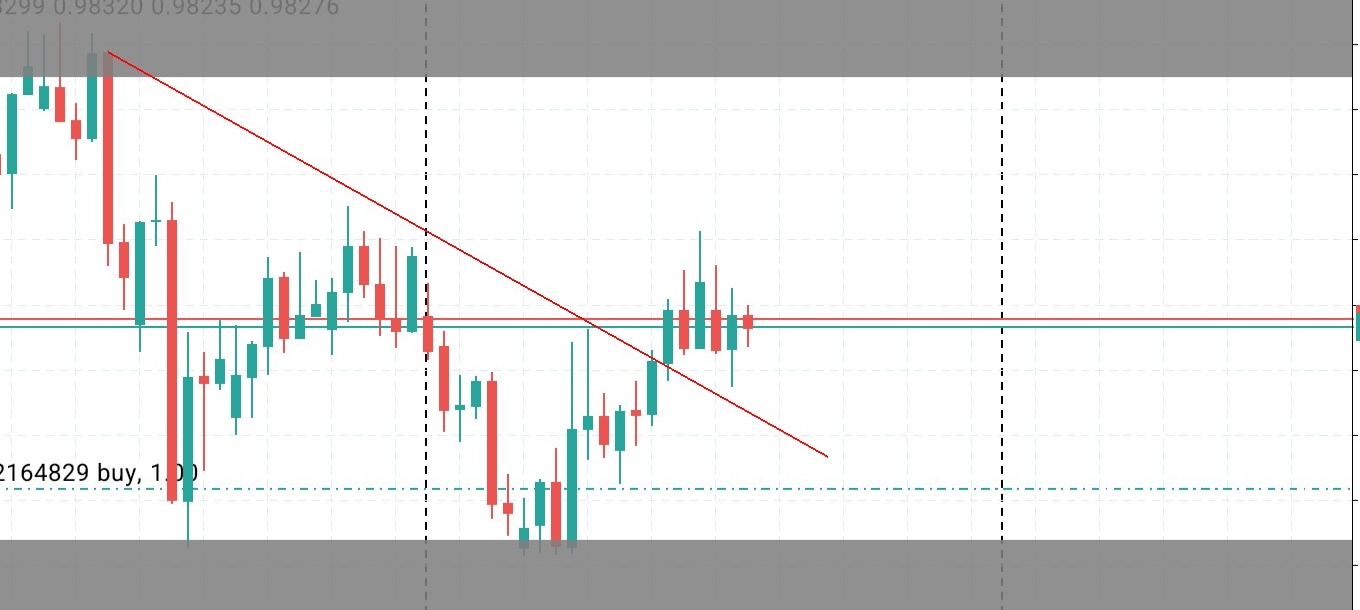
The asset has broken out of a descending trendline, retested it as support, and is establishing a base above a major horizontal key level. This price action suggests a reversal of the previous downtrend and a shift toward bullish momentum.
Trend
The previous structure was majorly bearish, characterized by a steep downtrend defined by a prominent descending trendline. However, price action on the right side of the chart shows a clear break above this red descending diagonal line, changing the market structure. This breakout and subsequent stabilization above the previous local structure highs at approximately 0.98235 suggest the transition to an emerging uptrend. A trend invalidation level would be established if the price falls back below the recent major swing low near 0.98050.
Patterns
A clear descending trendline breakout pattern is visible on the daily/hourly chart frame. Following the breakout, the price achieved a higher swing high and then consolidated above the breakout point, constructing a bullish flag/pennant-like structure. The current consolidation above the red and blue horizontal lines (around 0.98235) signifies price absorption and a strong potential for a continuation move upward.
Indicators
Key moving averages are not plotted on this chart, making MA-slope analysis unavailable. Standard technical indicators like RSI and MACD are also not present in this layout. However, horizontal volume nodes (implied by the consolidation levels at 0.98235) show strong acceptance at this price, while the price action shows rejection of lower levels as evidenced by the long lower wicks near the bottom support boundary.
Strategy
The suggested strategy is to maintain the current buy position or enter a long position near the current horizontal support zone of 0.98235. The stop-loss should be positioned below the recent swing-low cluster and the lower grey band limit at 0.98050 to manage risk effectively. The primary upside target is pointing toward the upper grey resistance zone around the swing highs of 0.98450.
For reference only, not investment advice. Trading decisions are your own.