XAUUSD Buy analysis
- Confidence
- 75
- Entry
- 4,104
- Target
- 4,124
- Stop
- 4,092
- Published
- 2026-07-27
Summary
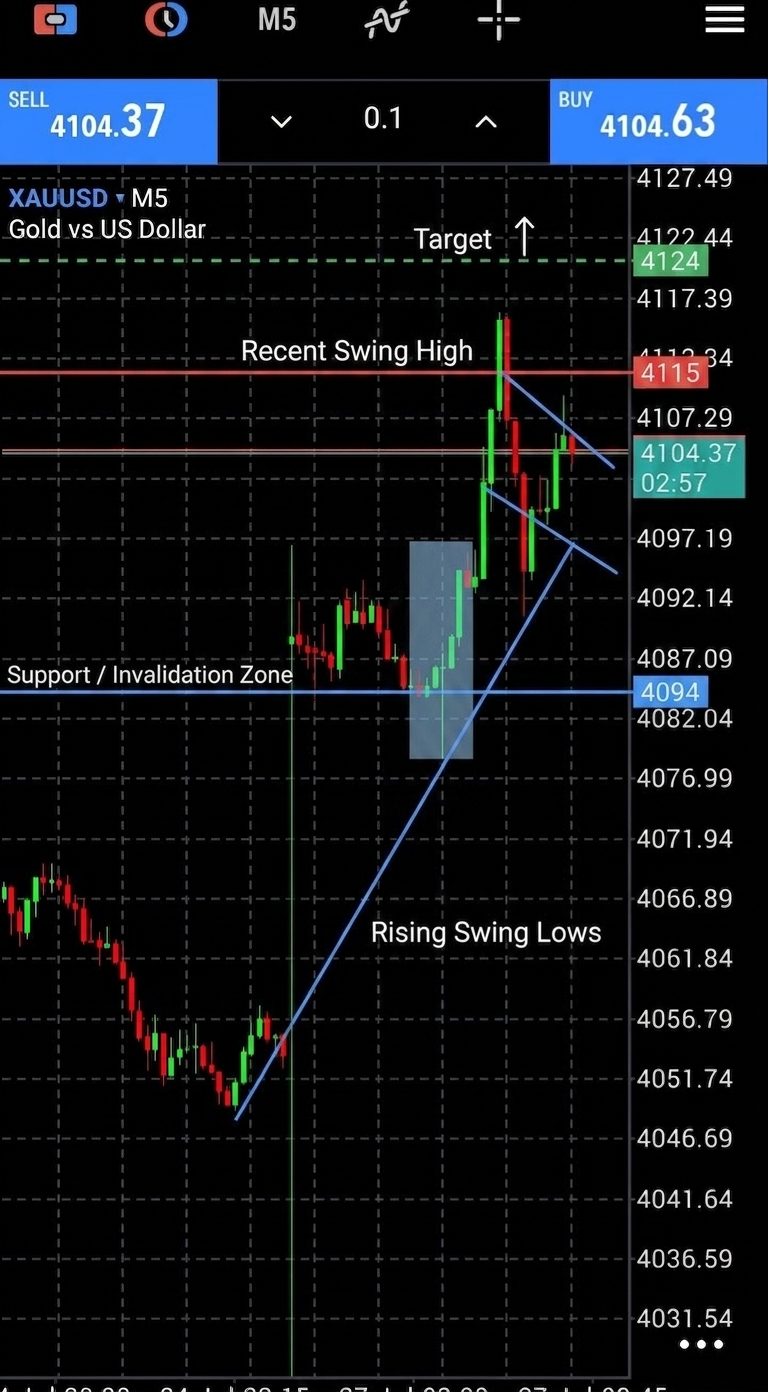
The short-term chart of XAUUSD shows a strong bullish continuation setup after a major vertical spike and subsequent healthy retracement. Buyers aggressively stepped in at the 4094 support level, suggesting the market is poised to test and break above the recent swing high of 4115.
Trend
The short-term trend on the 5-minute chart has transitioned to a strong bullish regime following a major gaps-up style vertical expansion from the 4050 level up to 4085. The market is structure is characteristically bullish, defined by a succession of rising swing lows from 4084 to 4094. The upward slope of these minor consolidations indicates that buyers dominate the order book. This bullish trend remains intact as long as the market prints candle bodies above the key invalidation zone at 4094.
Patterns
The price action reveals a classical bull flag continuation pattern following the rapid vertical leg up. After peaking at 4115, the price underwent a brief corrective phase back down to 4094, where it formed a bullish engulfing and hammer-like candlestick pattern characterized by a long lower shadow. This rejection of lower prices demonstrates clear accumulation and points to a target expansion above the previous swing high towards the 4124 mark.
Indicators
No technical indicators such as Relative Strength Index (RSI), Moving Average Convergence Divergence (MACD), or volume profile are plotted on this naked candlestick chart. Consequently, indicator-specific values are unavailable to supplement this analysis. Our technical read must depend entirely on pure candlestick dynamics and historical key-level reaction zones.
Strategy
We will initiate a long trade at the current market price of 4104 to capture the momentum of the unfolding third impulse wave. To manage risk effectively, an invalidation stop loss should be placed below the recent hammer candle low of 4094, specifically at 4092. The profit target is set at 4124, which lies just below the major psychological resistance levels and offers an ideal risk-to-reward ratio of nearly 2:1.
For reference only, not investment advice. Trading decisions are your own.