Gold Spot Sell analysis
- Confidence
- 75
- Entry
- 4,041
- Target
- 4,034
- Stop
- 4,046
- Published
- 2026-07-28
Summary
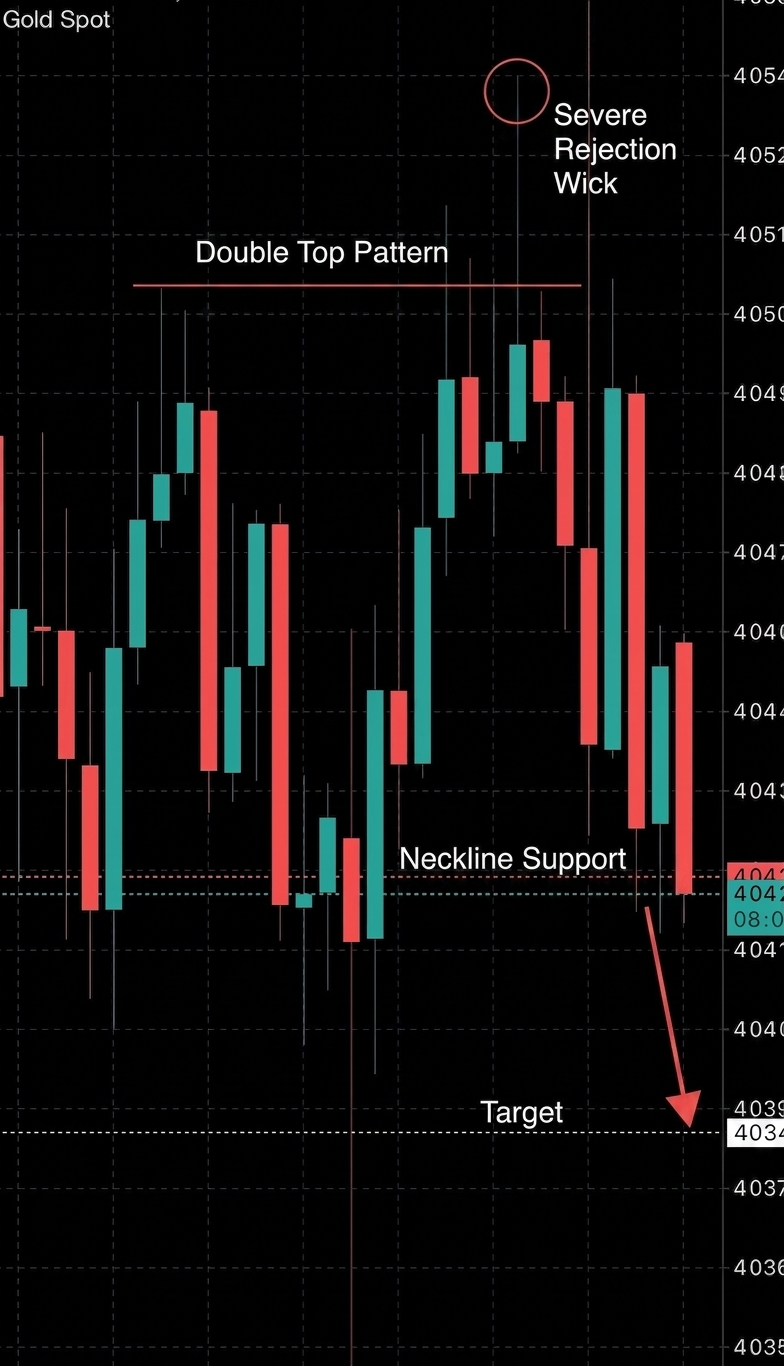
Gold Spot is testing a critical support level at 4042, forming a classical double top pattern with strong bearish momentum. A clean breakdown below this neckline targets the 4034 support zone, offering a high-probability short-selling opportunity.
Trend
The short-term trend has rotated from bullish to strongly bearish, as evidenced by consecutive large-bodied red candlesticks driving price back to local lows. Over the displayed period, the price failed to sustain breakout attempts above the 4050 level, resulting in a rapid breakdown of approximately 0.25% in a short duration. No moving averages are visible on this chart to confirm trend alignment, but the raw price action shows lower structural highs and an imminent test of key horizontal support. A confirmed break below 4042 officially shifts the market structure to bearish, invalidating any immediate recovery thesis.
Patterns
A prominent double top pattern has developed on this chart, with the first peak forming near 4049.5 and the second peak forming near 4050.5. The second peak is particularly notable for its exceptionally long upper shadow extending to 4056, indicating a severe rejection of higher prices by sellers. The neckline of this pattern is established at the key horizontal level of 4042, which was established by the swing low in the middle of the chart. The current candle is testing this neckline, and a decisive close below 4042 confirms the pattern, projecting a measured downward target of 4034.
Indicators
No technical studies or indicators such as RSI, MACD, or Bollinger Bands are plotted on this chart, making them unavailable for quantitative analysis. The volume sub-pane is also absent, which prevents confirmation of the sell-off with volume-based trend strength. Analysts must rely solely on candlestick structure, where the lack of lower wicks on the recent bearish candles confirms intense selling pressure heading into the support zone.
Strategy
The optimal strategy is to initiate a short position upon a confirmed daily or session-level breakout below the 4042 support floor. Position entry is recommended at 4041 to ensure the breakdown is active rather than a fakeout. The stop loss should be placed at 4046, just above the recent consolidation high, while the target take-profit is situated at 4034 in close alignment with the double top target.
For reference only, not investment advice. Trading decisions are your own.