Vol 20 Buy analysis
- Confidence
- 75
- Entry
- 120,567
- Target
- 120,780
- Stop
- 120,320
- Published
- 2026-08-03
Summary
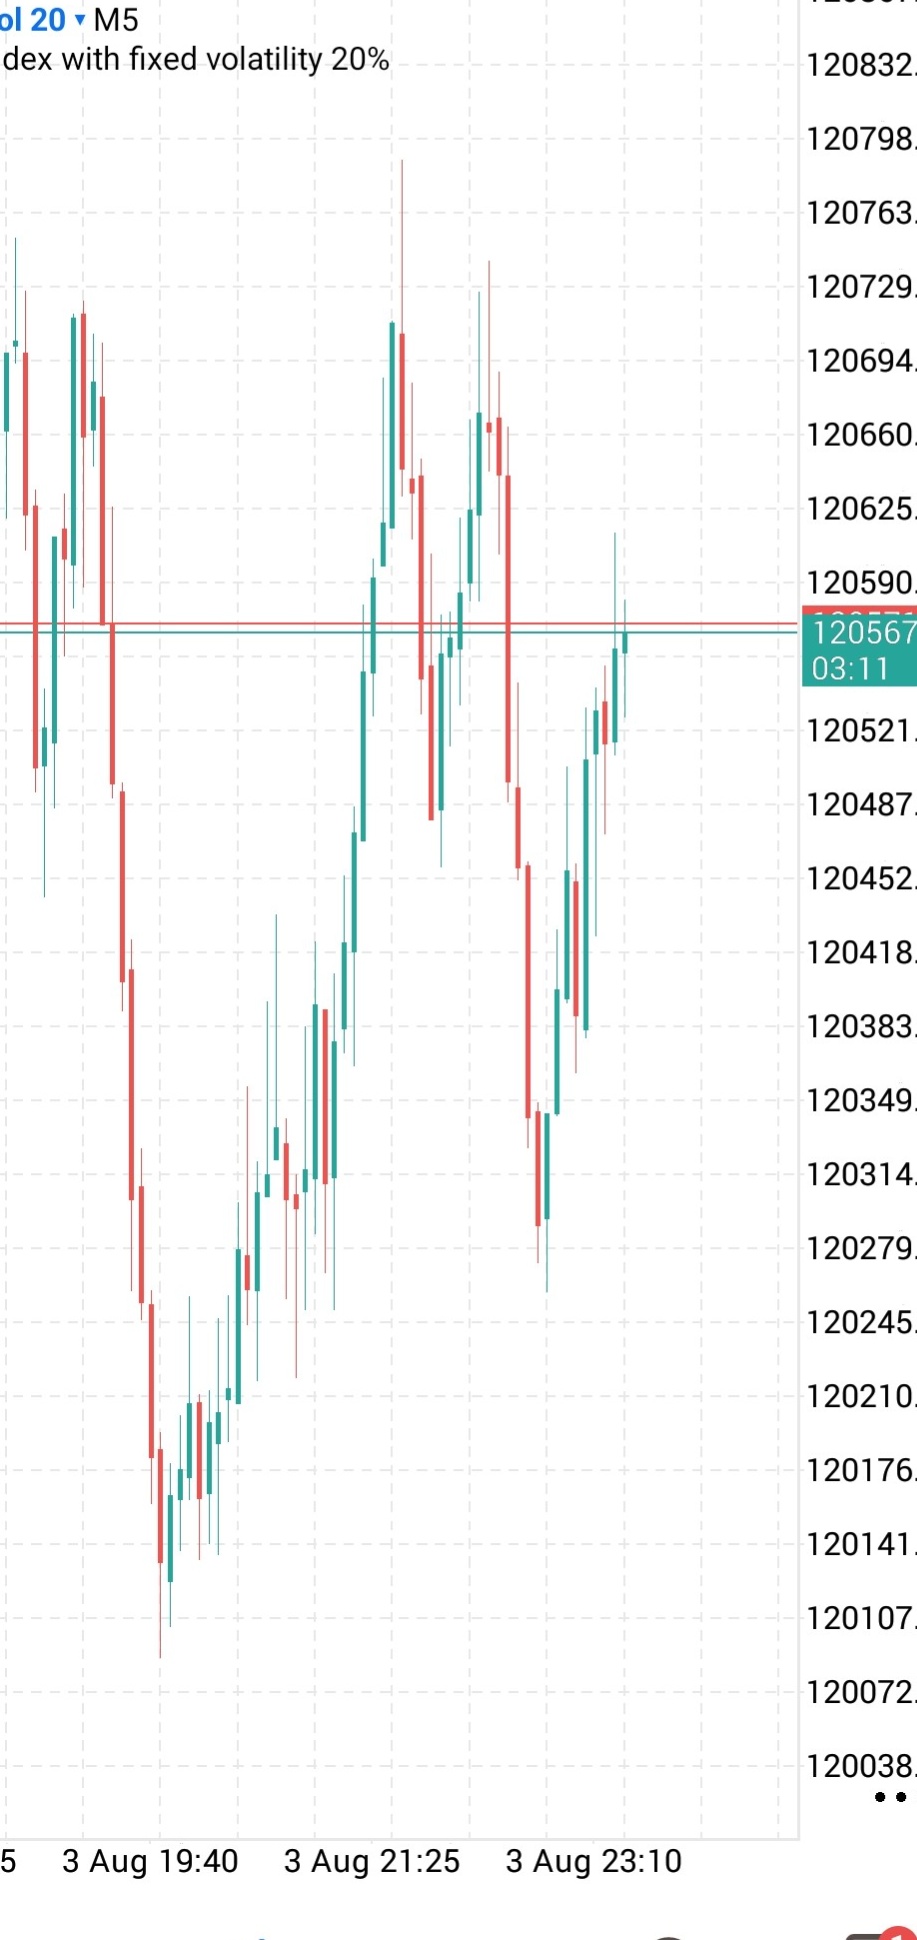
The asset has completed a successful retest of a key intraday support zone near 120280 and is resuming its short-term upward trajectory. A push toward the previous high near 120750-120800 is expected as buying volume accelerates on the M5 timeframe.
Trend
On the 5-minute timeframe, the market established a major swing low around 120110 before rallying aggressively up toward 120800. Following a natural retracement, price printed a clear higher low at approximately 120280 around 23:10. The current price action at 120567 shows steady green candles pushing upward, confirming the continuation of this short-term bullish market structure. A breakdown below 120280 would invalidate this immediate uptrend scenario.
Patterns
The price action reveals a double bottom / higher low structure, bouncing strongly off the 120280 support level. Additionally, recent M5 candlesticks feature long lower wicks during the sell-off phase, indicating strong buying pressure absorbing short trades. A minor resistance band is currently being tested near 120590, above which acceleration toward 120750 is highly probable.
Indicators
Standard moving averages and oscillating indicators like RSI or MACD are not explicitly overlaid on this chart view. However, price action structure shows strong bullish momentum with sequential green candles outperforming previous red bars. The strong rejection from lower price levels demonstrates underlying demand dominance.
Strategy
Enter a long position around the current market price of 120567 or on a slight dip toward 120520. Place a protective stop loss below the recent higher low at 120320 to limit risk. Set the primary take-profit target near the previous swing high at 120780, offering an attractive risk-to-reward ratio.
For reference only, not investment advice. Trading decisions are your own.